▸ LIQUIDITYSCAN RESEARCH
The Blog
Institutional analysis for ICT and Smart Money traders — order flow, liquidity, structural patterns.
How to Detect BOS and CHoCH Automatically Across Every Pair
A market structure scanner applies one fixed swing rule and one close-through test to every pair, so BOS and CHoCH are flagged the same way on chart after chart, with no repainting after the candle closes.
 Hayk Muradian·
·10 min
Hayk Muradian·
·10 min
Are Order Blocks Real or Hindsight Bias? An Order-Flow Reality Check
Are order blocks real? Partly - the mechanics beneath them (order splitting, resting liquidity, stop clustering) are documented microstructure, but the pattern only carries edge under strict falsifiable rules; here is the honest case from both sides, and how to test it yourself.
Hayk Muradian·
·12 min
How to Catch Asian-Range Sweeps Every Session
The Asian-range sweep is a once-per-day, time-boxed sequence you'd otherwise track by hand on every coin. An asian range sweep scanner marks the range, reads the daily bias, and flags the against-bias sweep and reclaim for you.
Hayk Muradian·
·10 min
Unmitigated vs Mitigated Order Blocks: Which Ones Still Work?
An unmitigated order block — one price has never returned to — carries the highest reaction odds because the institutional orders inside it are presumed unfilled. Mitigated blocks are consumed zones: tradable only in specific second-life scenarios, and dangerous everywhere else.
Hayk Muradian·
·12 min
What Is a Volume Imbalance? Body Gaps vs Fair Value Gaps
A volume imbalance (VI) is a gap between two consecutive candle bodies whose wicks still overlap: price traded the range, but only in wicks, on thin one-sided volume. It is not a fair value gap, and the difference changes how you should trade both.
Hayk Muradian·
·12 min
How to Scan for Liquidity Sweeps and Stop-Hunt Reversals in Real Time
A liquidity sweep scanner watches every swing high and low across hundreds of pairs, then flags the moment price sweeps that level and closes back through it on a lower timeframe. Here is what a trustworthy one must detect, and how to trade its output.
Hayk Muradian·
·10 min
What Is Inducement (IDM) in Smart Money Concepts?
Inducement (IDM) is an engineered pocket of liquidity — a minor swing placed between current price and the real point of interest — designed to trap early entries whose stops fuel institutional fills. Here is how to identify it and why "IDM first" is the filter that saves SMC trades.
Hayk Muradian·
·11 min
What Is a Protected Swing High and Low in ICT?
A protected swing is the high or low the market must defend for the current ICT structure to stay valid. It forms when a raid on liquidity is followed by displacement that breaks structure; while it holds the trend read is intact, and a close through it flips the narrative.
Hayk Muradian·
·12 min
How to Scan for Premium and Discount Zones Automatically
Premium and discount is not a signal you scan for directly — it is a location filter you derive from the dealing range and its 50% equilibrium. The practical move is to scan for setups, then keep only the ones sitting in the correct half.
Hayk Muradian·
·10 min
FVG vs Order Block: Which Entry Zone Should You Trade?
An order block is the last opposing candle before displacement; a fair value gap is the imbalance that displacement leaves behind. FVGs get tapped first and suit trend continuation; OBs sit deeper and shine at reversals — and the strongest entries combine both.
Hayk Muradian·
·11 min
Every ICT Concept Explained: The Complete List
Every core ICT concept in one place: 40+ terms across liquidity, market structure, PD arrays, time-based tools, entry models, and bias — each defined in two or three sentences with the reason it matters on a live chart.
Hayk Muradian·
·15 min
How to Find Strong Order Blocks That Took Liquidity (OB+ and OB++)
A strong order block scanner keeps only the order blocks that actually took liquidity — the last opposite candle before an impulse that swept a prior swing. Graded OB+ (took BSL/SSL) and OB++ (+ displacement ≥ 1.5× ATR), it filters the noise and pings you on the retest.
Hayk Muradian·
·11 min
Is ICT Trading Legit? Separating Method From Hype
Yes and no — ICT is legit as a framework, because stop clustering and liquidity sweeps are documented market behavior, but it is not a guaranteed system and its interbank-algorithm narrative is unproven. Here is the evidence on both sides, without the hype.
Hayk Muradian·
·10 min
How to Trade ICT/SMC with a Full-Time Job
You cannot watch charts all day, and ICT rewards being present in the kill zone. The fix is not more screen time. It is picking one session that fits your timezone, marking levels the night before, and placing set-and-forget limit orders.
Hayk Muradian·
·11 min
Fibonacci in ICT: Which Levels Actually Matter (and Why)
ICT strips Fibonacci down to a value proxy: anchor it swing low to swing high on the dealing range (wicks included), then trade around 0.5 equilibrium, the 0.62-0.705-0.79 OTE band, and negative extensions for targets. Every other level on the default retail fib is noise.
Hayk Muradian·
·11 min
How to Scan for Order Blocks and FVGs Automatically in Real Time
Order blocks and FVGs reduce to exact candle geometry, which makes them machine-detectable in real time. Here is what an order block scanner must check — liquidity taken, displacement, freshness, nesting — why manual scanning fails past ~30 symbols, and how to trade the alerts it produces.
Hayk Muradian·
·12 min
Confluence Trading: Combining Premium/Discount with FVGs and Order Blocks
Premium and discount confluence is the filter that separates A+ order blocks and FVGs from average ones: buy bullish arrays only from the discount half, sell bearish arrays only from premium. Location is the edge.
Hayk Muradian·
·10 min
ICT vs SMC vs Classic Price Action: What's Actually Different
ICT, SMC, and classic price action mark similar levels but disagree on why price moves: an algorithm delivering price to liquidity on schedule, institutional flow without the clock, or crowd psychology at remembered levels. That disagreement changes entries, stops, and trade selection.
Hayk Muradian·
·13 min
Liquidity in ICT: Why Price Moves to Buy-Side and Sell-Side Pools
In ICT, liquidity is not volume — it is the mass of resting stop and pending orders pooled above equal highs and below equal lows. Institutions need those orders as counterparties, which is why price is repeatedly drawn to the pools, sweeps them, and reverses.
Hayk Muradian·
·11 min
What Is Curve Fitting (Overfitting) and How to Avoid It in Trading
Curve fitting is when you tune a strategy so tightly to historical data that it captures random noise instead of a real edge. It looks perfect in the backtest and falls apart live. Here is why it happens and how to build robust rules instead.
Hayk Muradian·
·10 min
Fair Value Gap vs Imbalance vs Liquidity Void: Clearing the Confusion
A fair value gap is a specific three-candle construct, an imbalance is the umbrella term for any one-sided price delivery, and a liquidity void is a multi-candle vacuum that often contains several FVGs. Most traders use all three interchangeably — and it costs them precision at entry.
Hayk Muradian·
·11 min
What Is a Swing High and Swing Low in ICT? The 3-Candle Rule
A swing high forms when a candle's high is above the highs of the candles on either side of it; a swing low is the mirror image. This 3-candle rule is the atomic unit of ICT market structure — every BOS, CHoCH, and liquidity pool is built from these points.
Hayk Muradian·
·10 min
FOMO in Trading: Why You Chase Entries and How to Beat It
FOMO in trading is the fear of missing out that pushes you to enter a trade late, at a worse price, outside your plan, because price is running without you. It quietly wrecks more good ICT traders than any bad setup.
Hayk Muradian·
·10 min
Order Block vs Supply and Demand Zone: The Real Difference
An order block is a single candle — the last opposite candle before a displacement that takes liquidity. A supply and demand zone is a basing area before an imbalanced departure. This guide compares the two constructs at chart level: drawing, validation, entries, and where they overlap.
Hayk Muradian·
·11 min
MSS vs BOS: The Difference Between a Structure Shift and a Break of Structure
A BOS breaks structure in the direction of the trend and confirms continuation. An MSS breaks the opposite-side swing with displacement and flips the trend. Same event type, opposite meaning.
Hayk Muradian·
·10 min
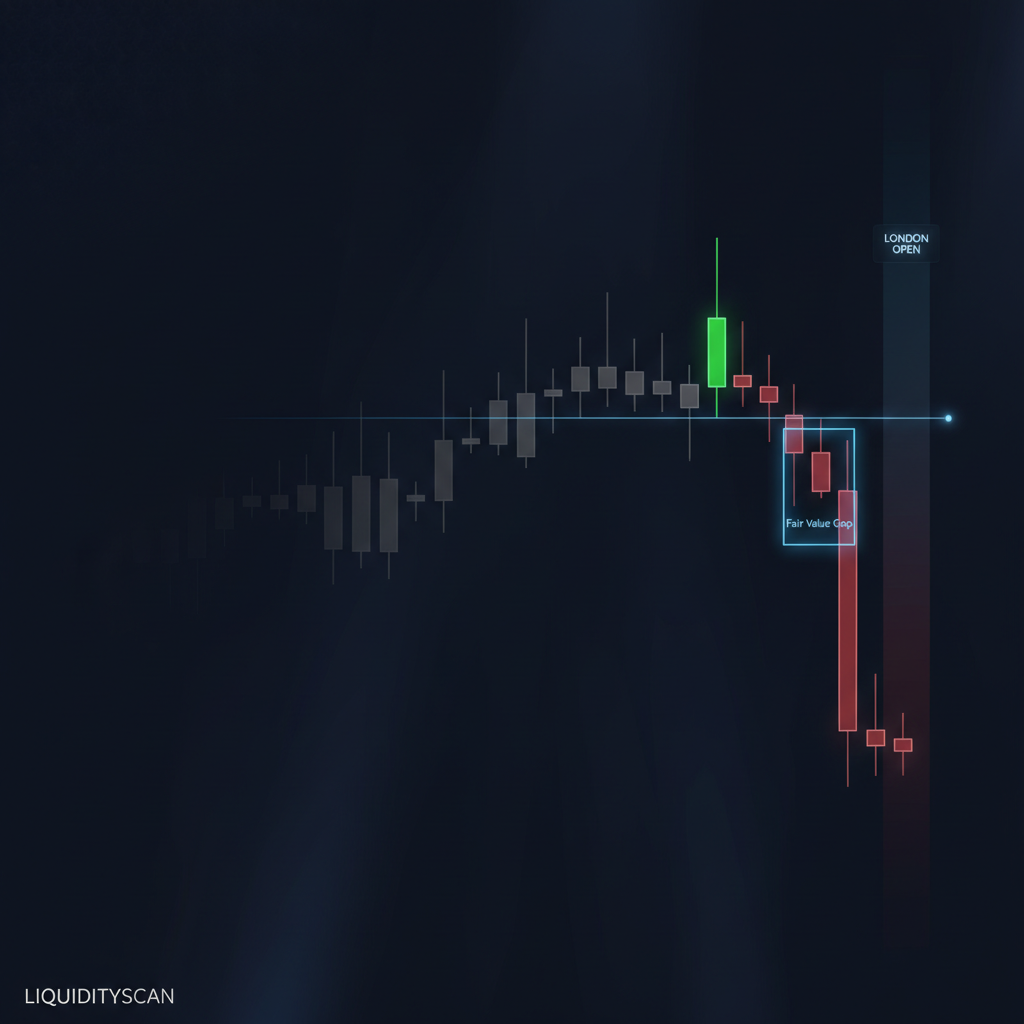
What Is the Judas Swing in ICT Trading?
The Judas Swing is the false session-open move that traps breakout traders, sweeps their stops, then reverses into the real trend for the day.
Hayk Muradian·
·5 min
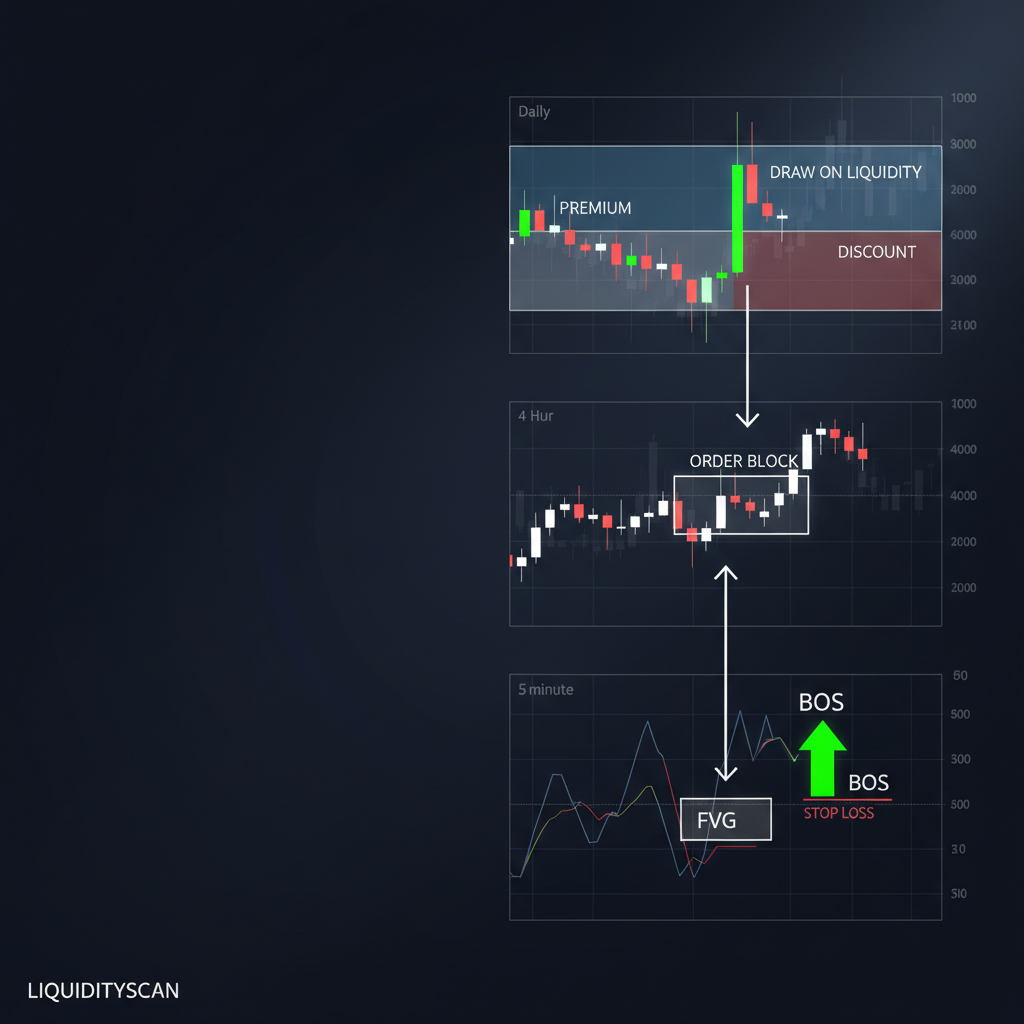
Best ICT Timeframes: HTF Bias to LTF Entry Guide
The best ICT timeframes aren't one setting — they're a pair. HTF sets bias and draw, LTF times the entry. Here's how to match them.
Hayk Muradian·
·5 min
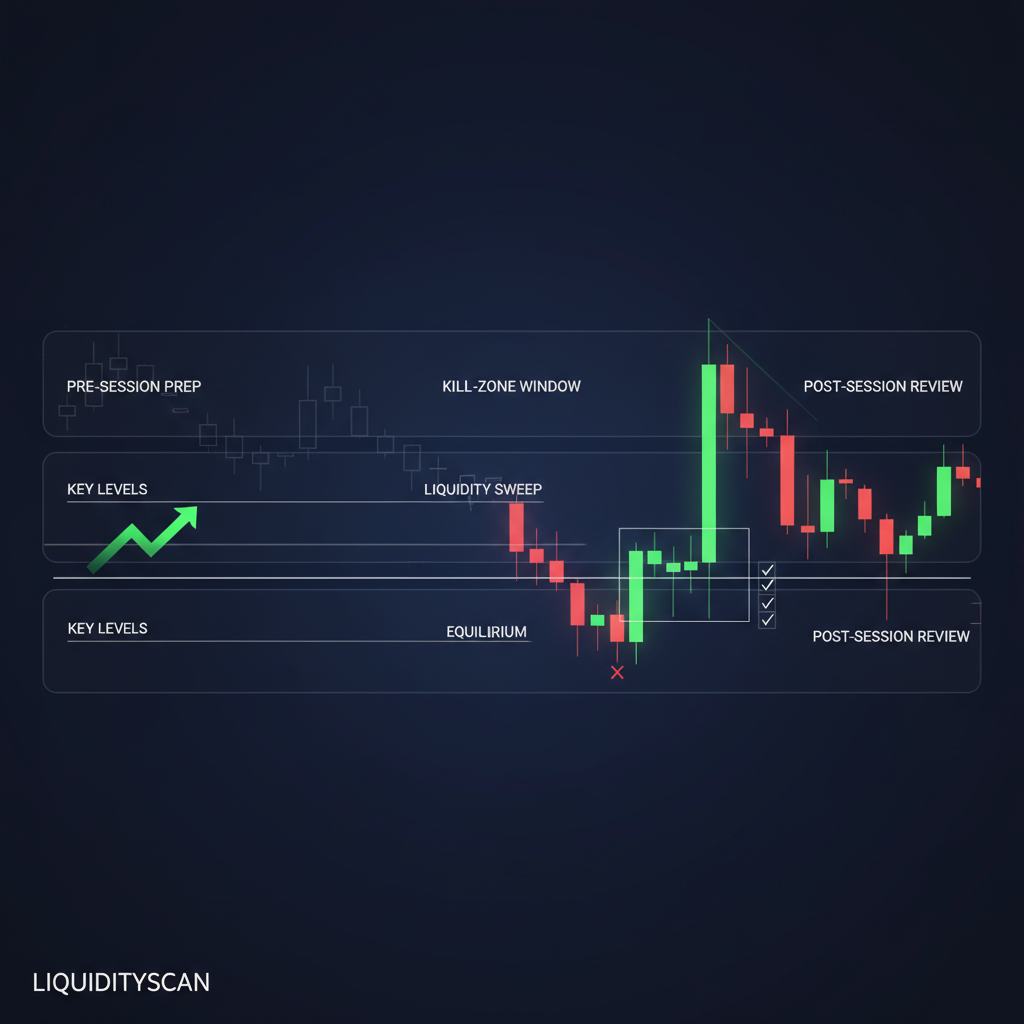
The Professional ICT Trading Routine: A Daily Playbook
Consistency in ICT comes from a repeatable routine, not a secret setup. Here is the daily loop professionals actually run.
Hayk Muradian·
·6 min

What a Profitable Trader Equity Curve Looks Like
A profitable equity curve stair-steps up through drawdowns and flat patches. Here's what a real ICT edge actually looks like on paper.
Hayk Muradian·
·6 min
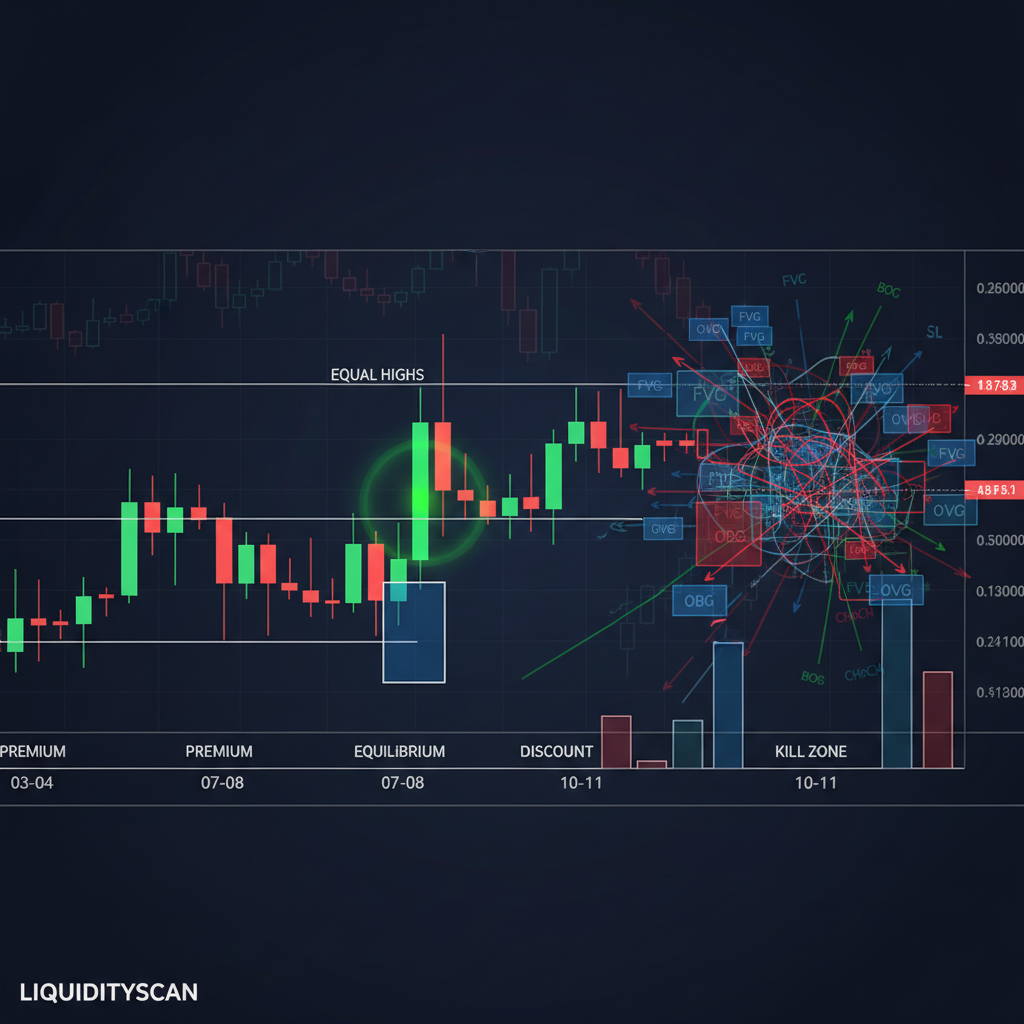
Why ICT Traders Fail: 5 Mistakes That Kill Accounts
Most ICT traders fail for the same five reasons. Here's each failure mode paired with the fix that actually moves your equity curve.
Hayk Muradian·
·6 min
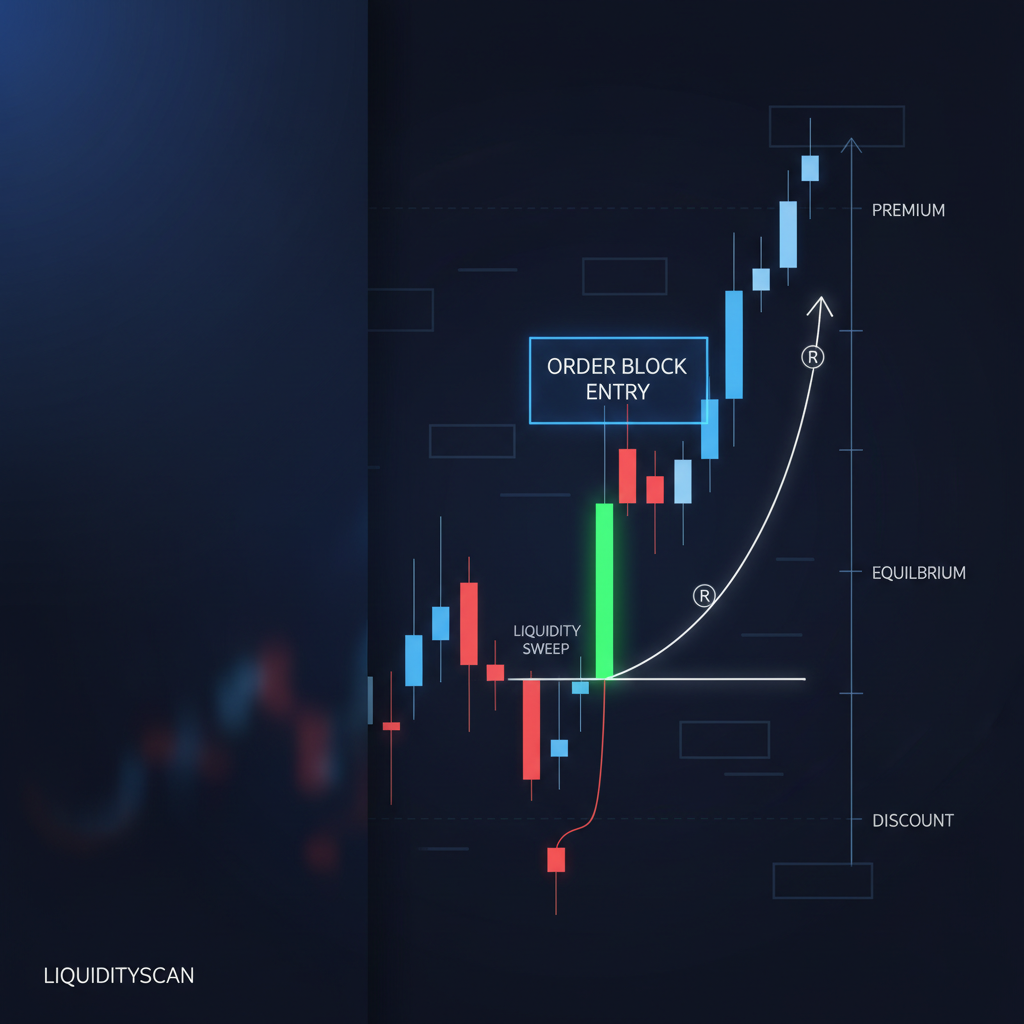
Going Full-Time With ICT Trading: An Honest Roadmap
Going full-time with ICT trading is a math and evidence problem, not a motivation problem. Here are the milestones that actually gate the decision.
Hayk Muradian·
·6 min
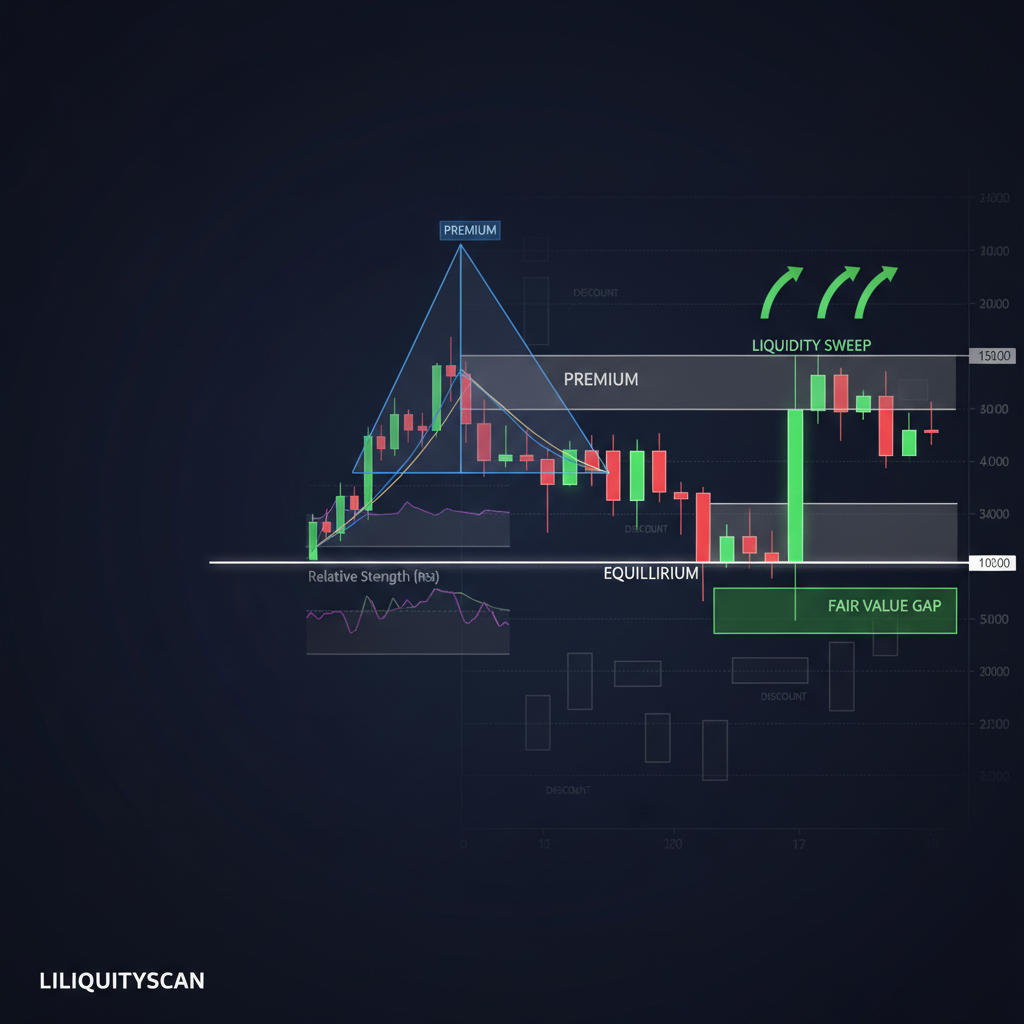
ICT vs Traditional Technical Analysis: A Trader's Guide
ICT and traditional technical analysis read the same charts but ask different questions. One tracks patterns; the other tracks why price moves.
Hayk Muradian·
·5 min
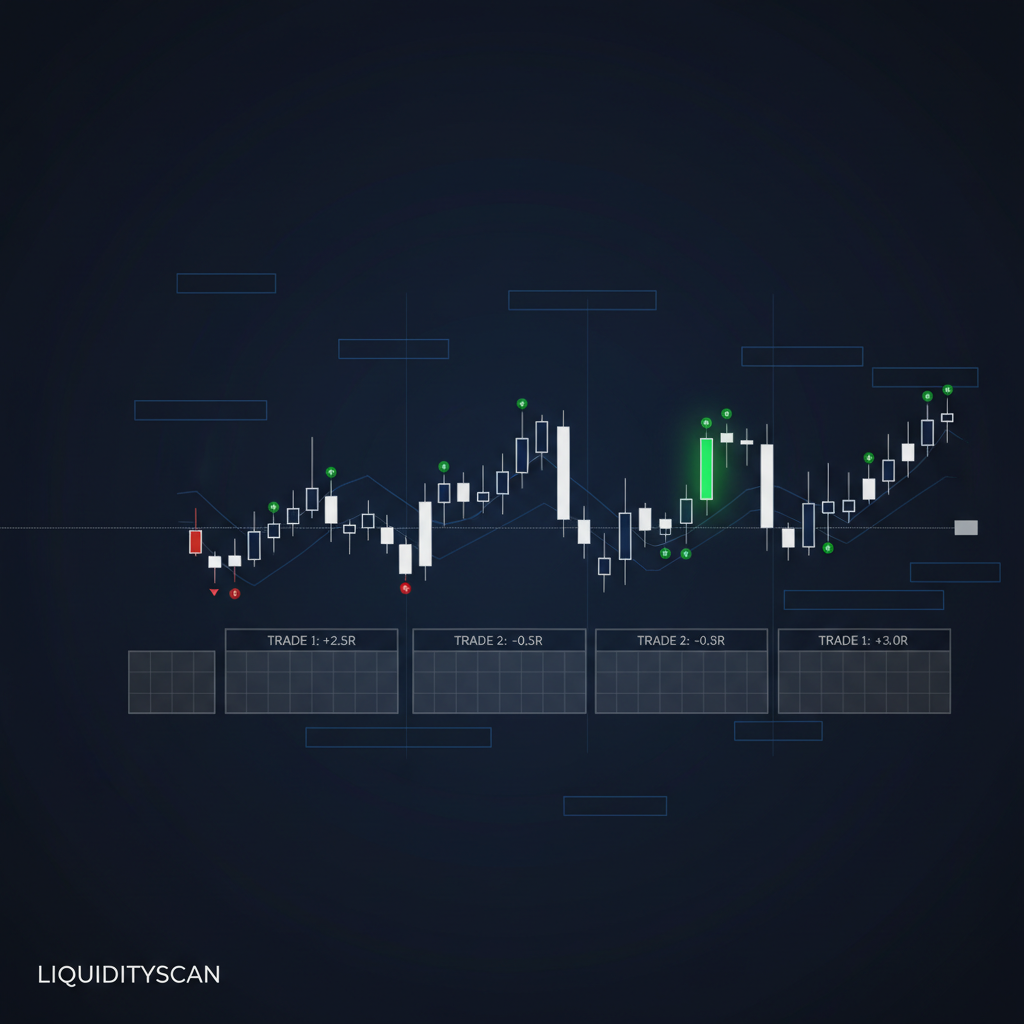
The ICT 3-6-9 Theory Explained: A Consistency Framework
The ICT 3-6-9 theory isn't numerology. It's a discipline for compounding a small, repeatable edge over defined intervals of trades.
Hayk Muradian·
·5 min
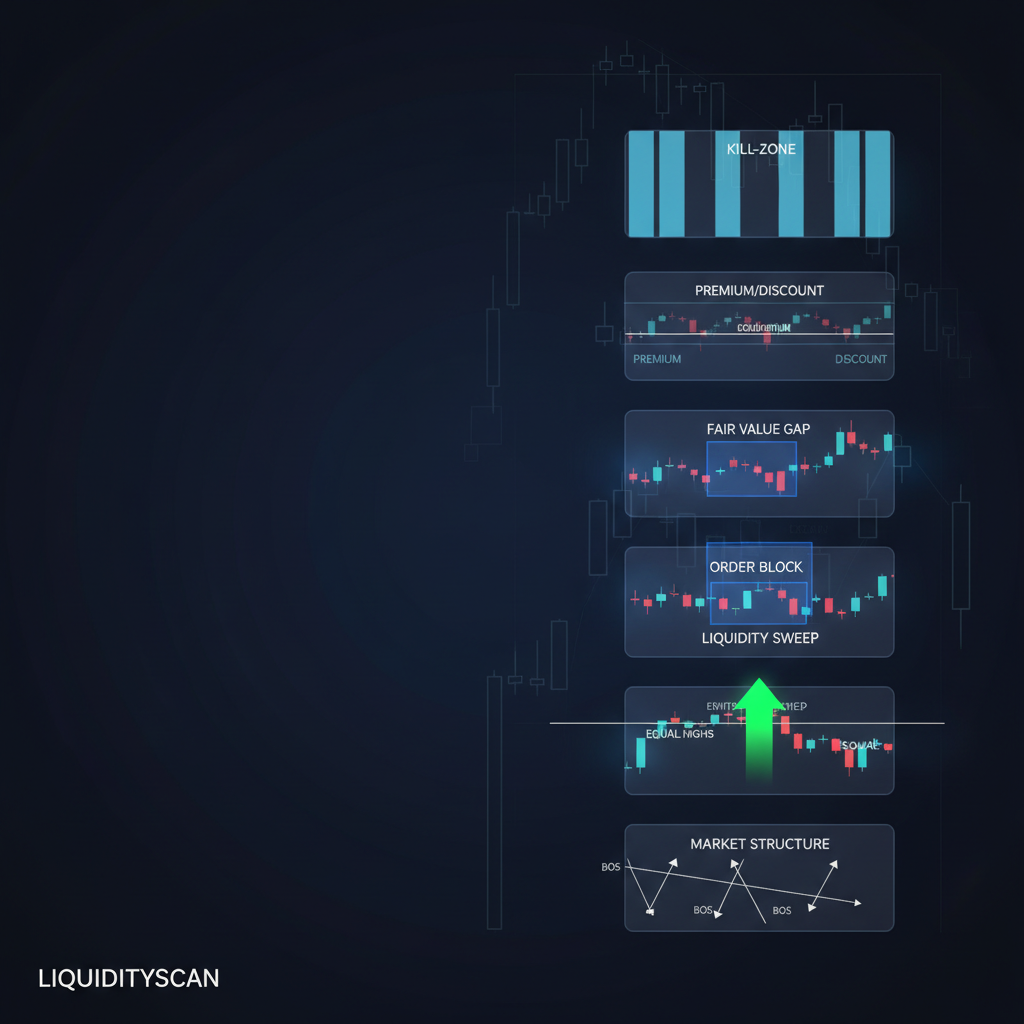
ICT Books & Learning Resources: The Real Path
ICT was taught through free video mentorships, not books. Here's the concept order that actually builds skill, and how to study it.
Hayk Muradian·
·6 min
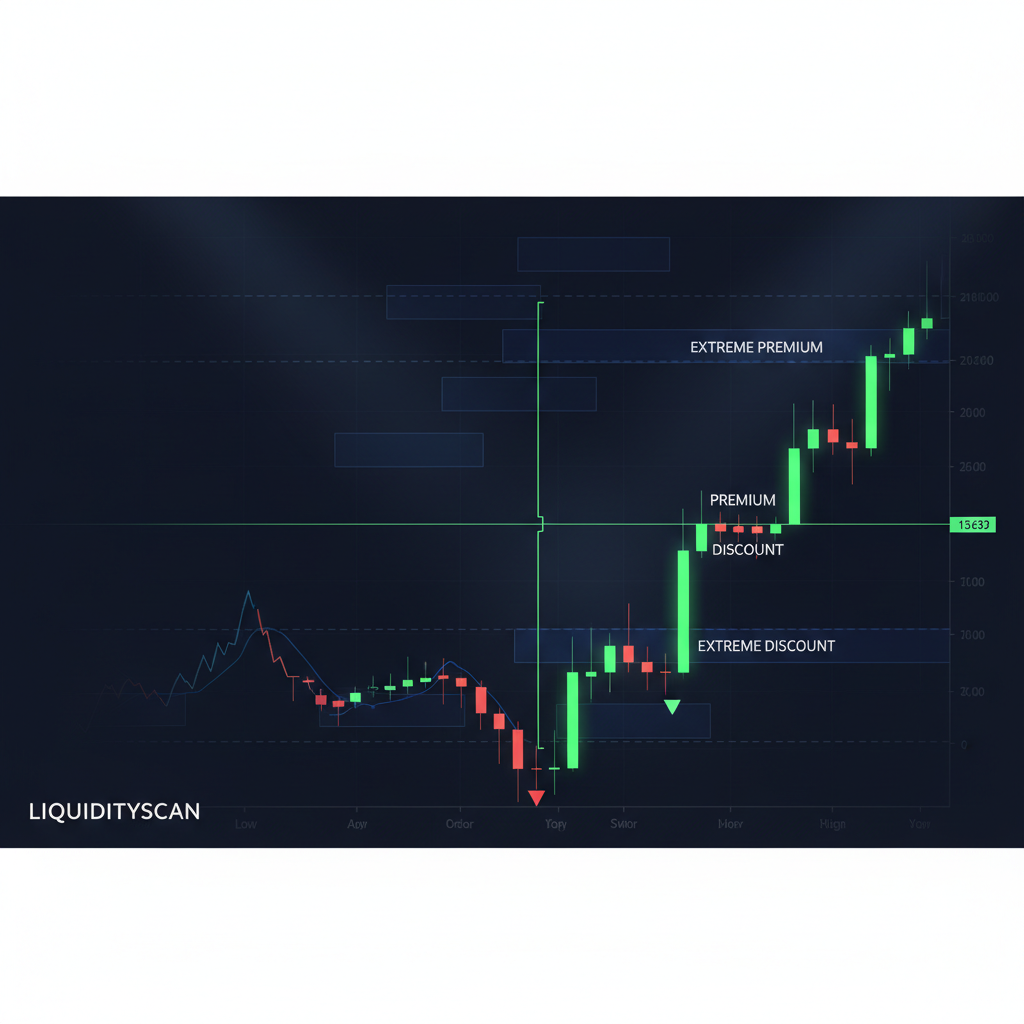
What Are the 4 Trading Zones? ICT Dealing Range
The four ICT trading zones split any dealing range into premium, discount, equilibrium, and the two extremes that frame your best entries.
Hayk Muradian·
·4 min
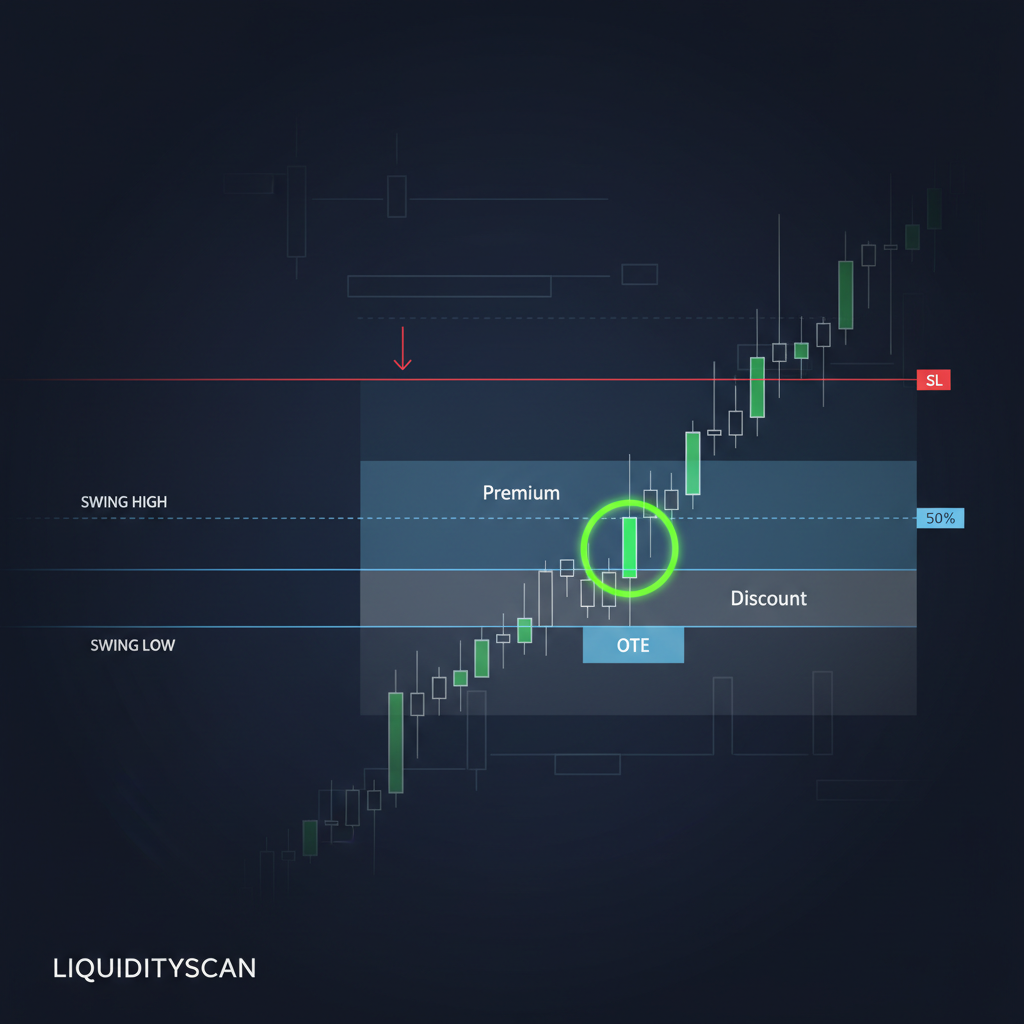
How to Draw a Dealing Range in ICT (Correctly)
A dealing range is only useful if its two anchors took liquidity. Here is how to draw one correctly and know when it dies.
Hayk Muradian·
·5 min
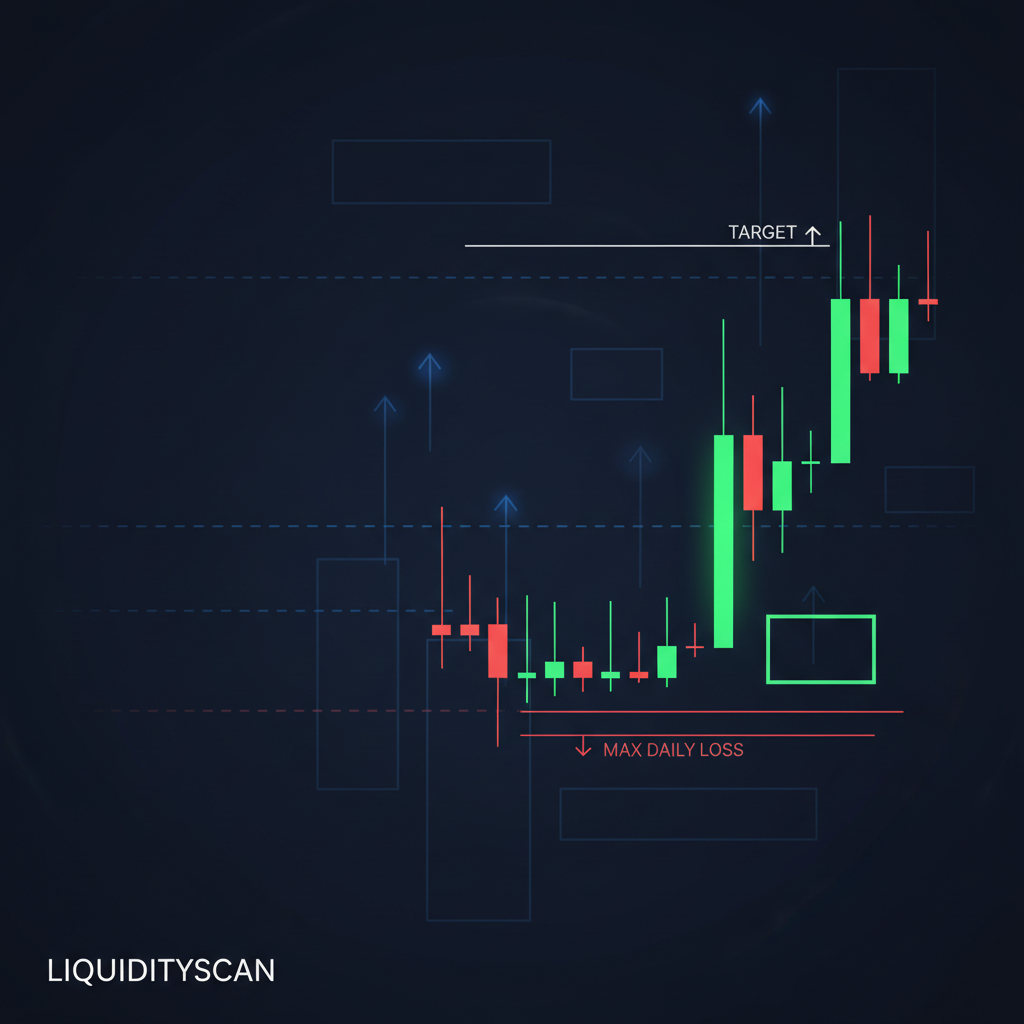
ICT Prop Firm Strategy: How to Pass the Challenge
Passing a prop challenge with ICT is a rules problem, not a setup problem. Match your model to the firm's drawdown math and trade less.
Hayk Muradian·
·6 min
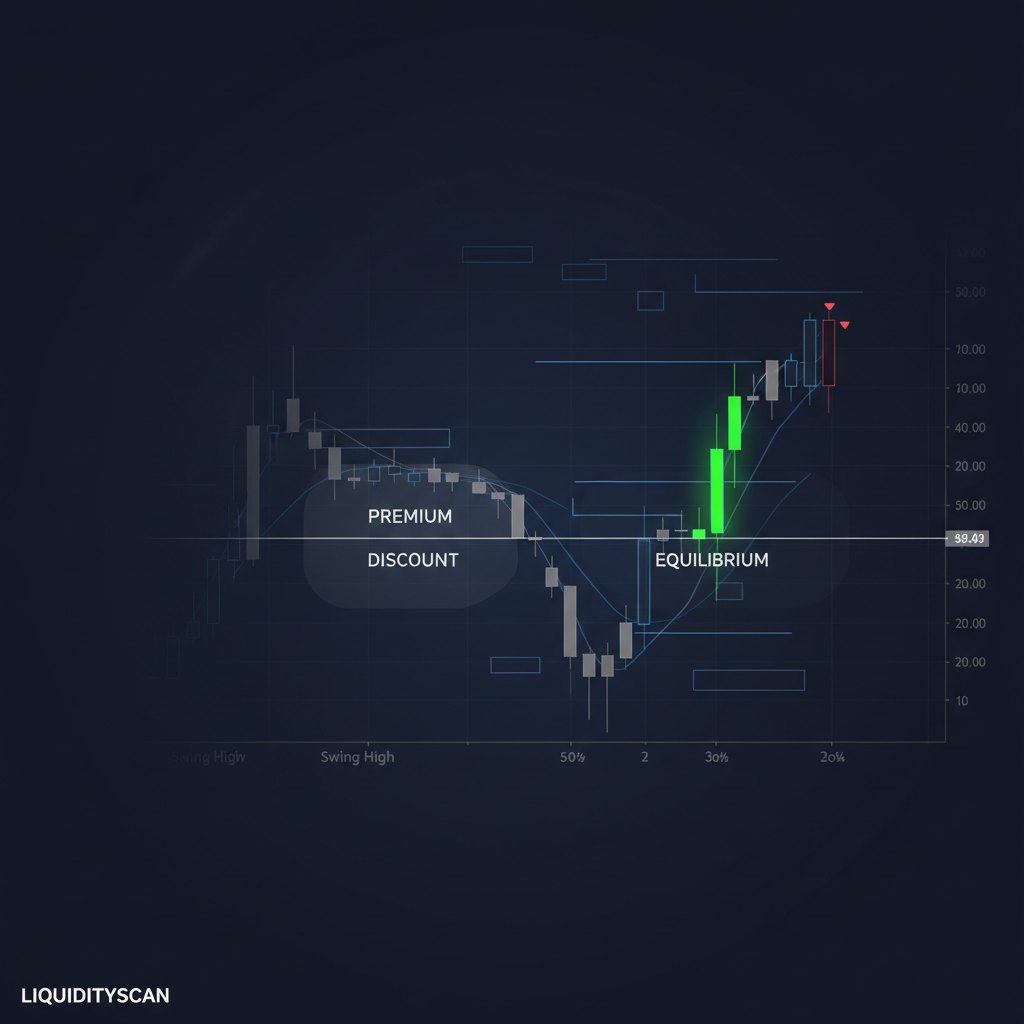
How to Draw Premium & Discount Zones (ICT Guide)
Premium and discount zones start with one correct swing high and swing low. Get the dealing range right and the 50% line does the rest.
Hayk Muradian·
·5 min
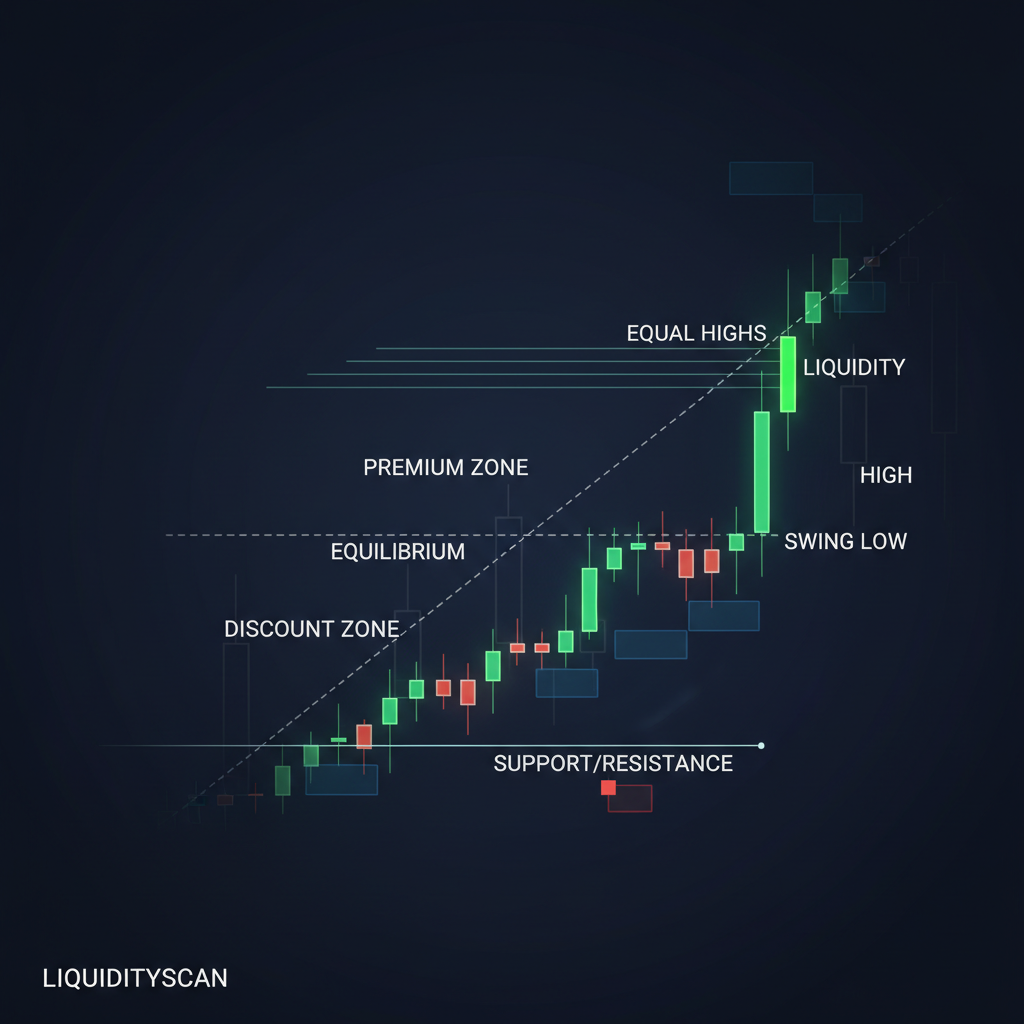
Premium & Discount vs Support & Resistance (ICT)
Support and resistance is horizontal memory. Premium and discount is a valuation model tied to the dealing range and the algorithm behind it.
Hayk Muradian·
·5 min
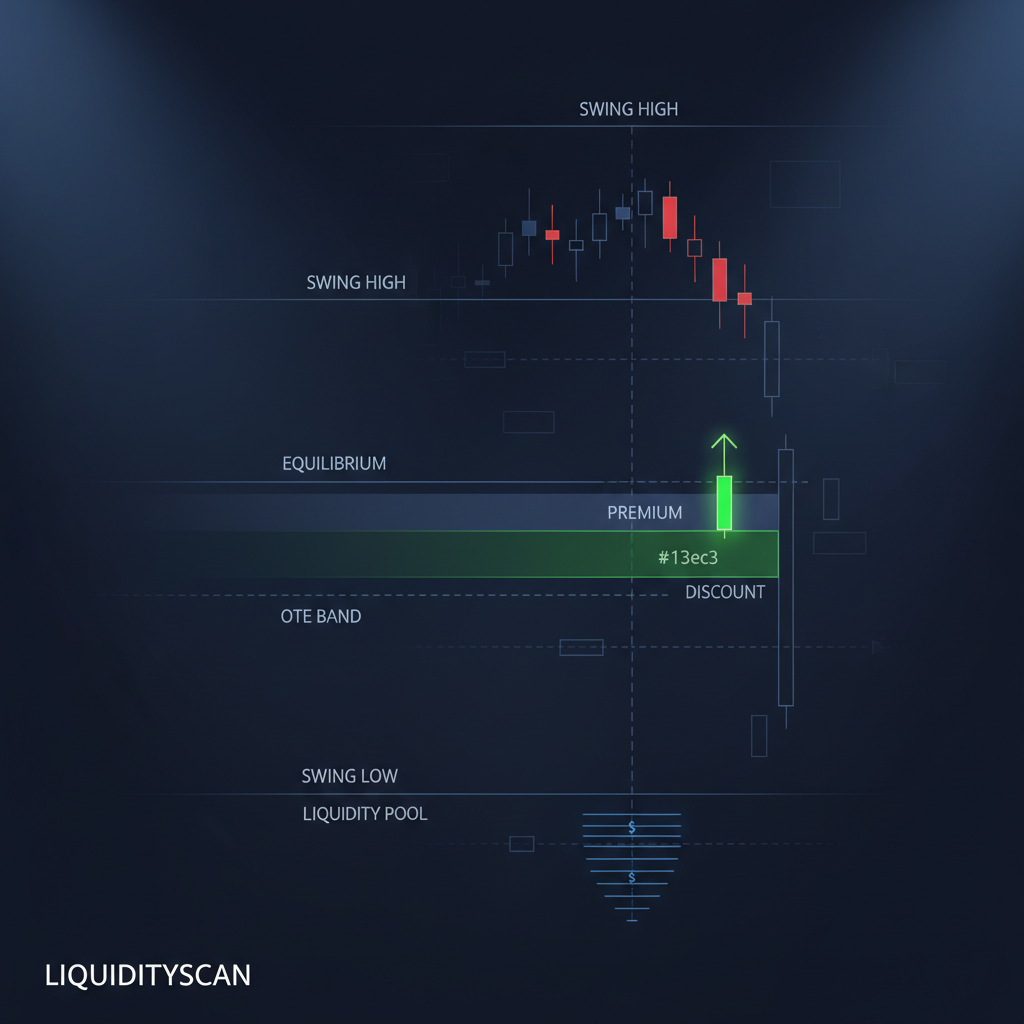
Equilibrium vs OTE: The Right ICT Entry Level
Equilibrium is the 50% of a range; OTE is the 62-79% zone. Here's exactly when each is the smarter entry.
Hayk Muradian·
·5 min
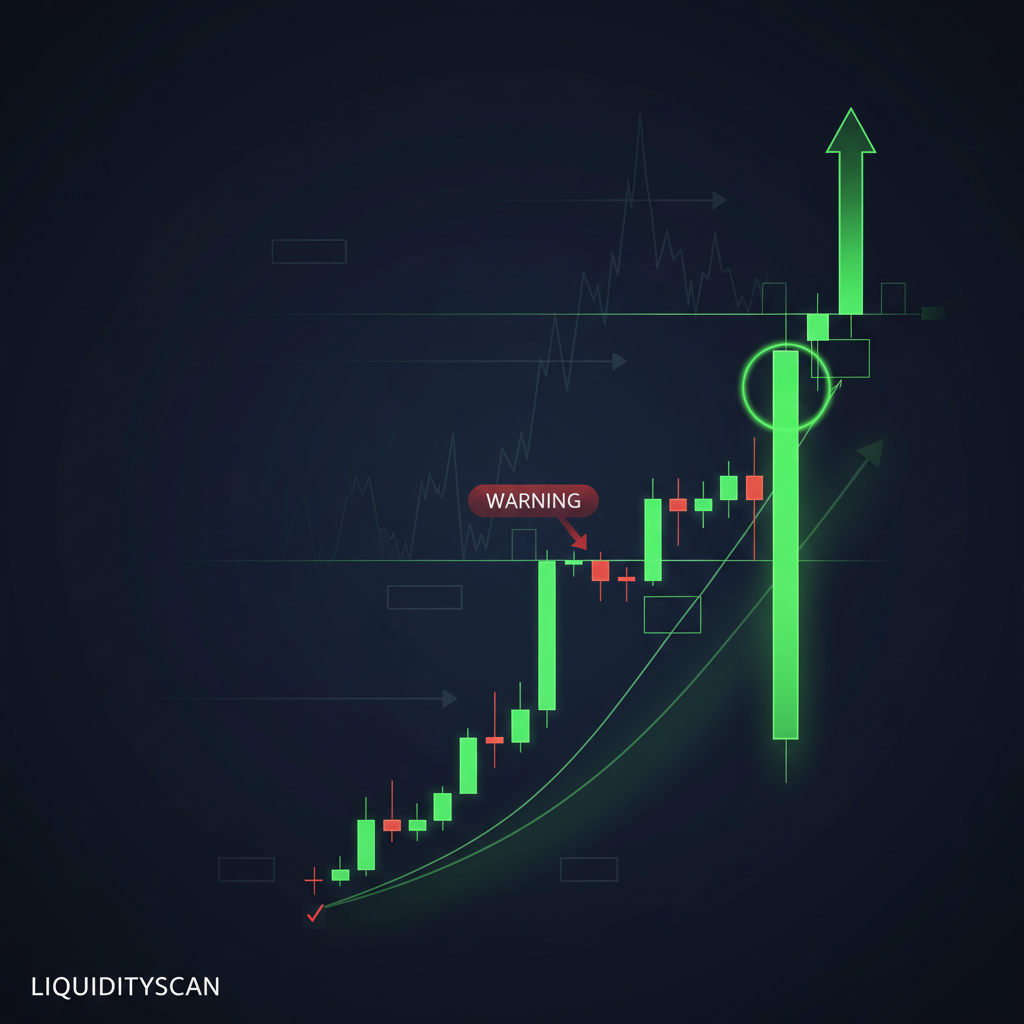
CHoCH vs MSS: The Real Difference in ICT
CHoCH and MSS are not synonyms. One flags a warning inside structure; the other confirms intent with displacement. Here's the precise line between them.
Hayk Muradian·
·5 min
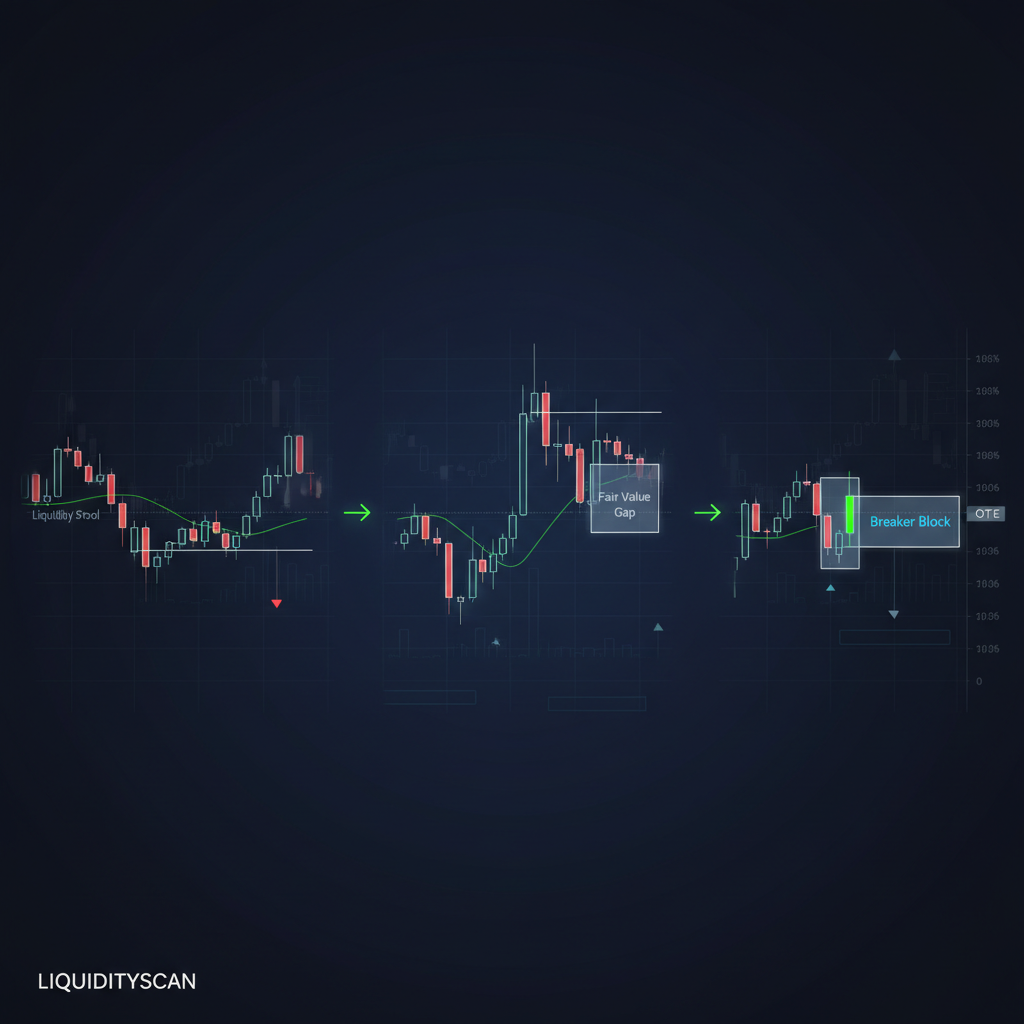
Evolution of ICT Concepts: A Timeline of Key Models
ICT didn't arrive fully formed. It grew from loose liquidity theory into mechanical entry models — and each step solved a real problem.
Hayk Muradian·
·6 min
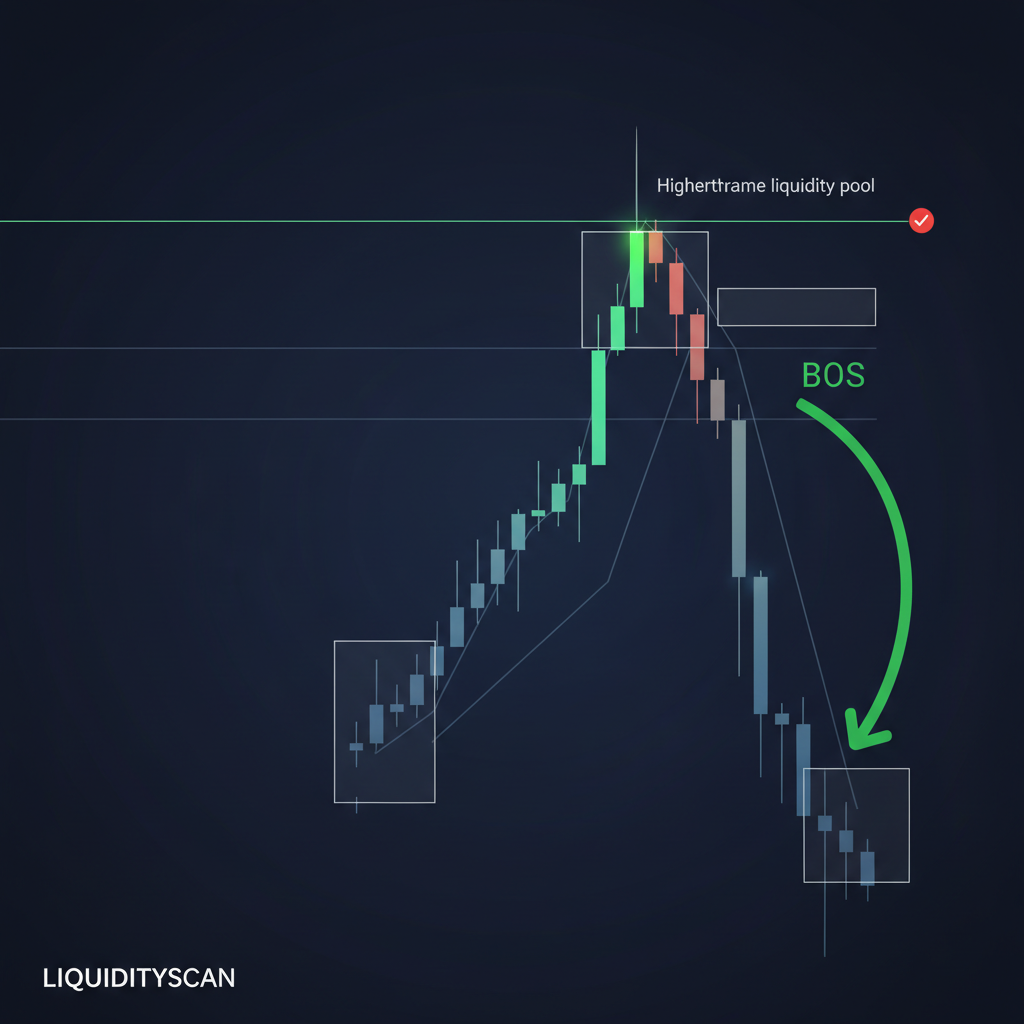
Is Order Block Strategy Profitable? A Data Look
Order block trading can be profitable, but the edge lives in context and R-multiples, not in the rectangle you drew on the chart.
Hayk Muradian·
·5 min
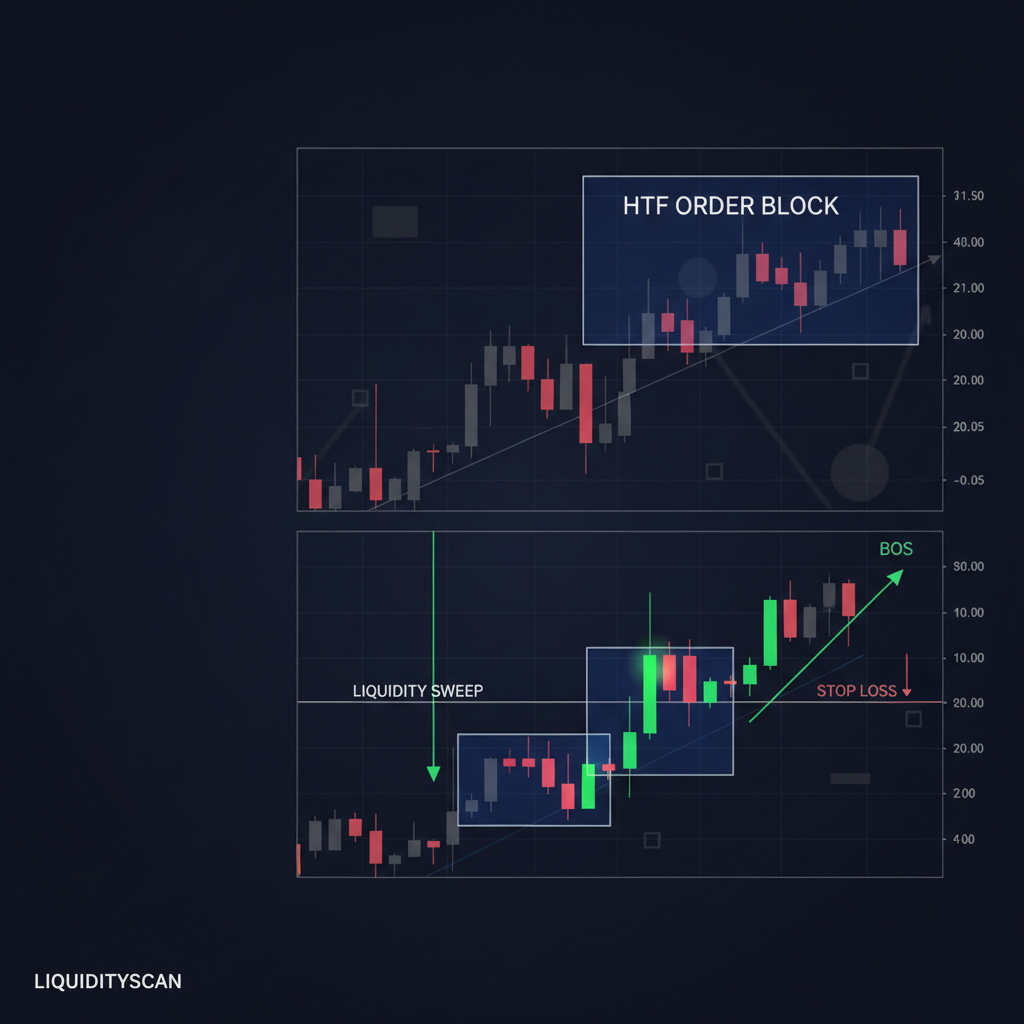
Best Timeframe for Order Block Trading (ICT Guide)
The best timeframe for an order block isn't one chart — it's a pairing. The HTF marks the zone, the LTF times the entry.
Hayk Muradian·
·5 min
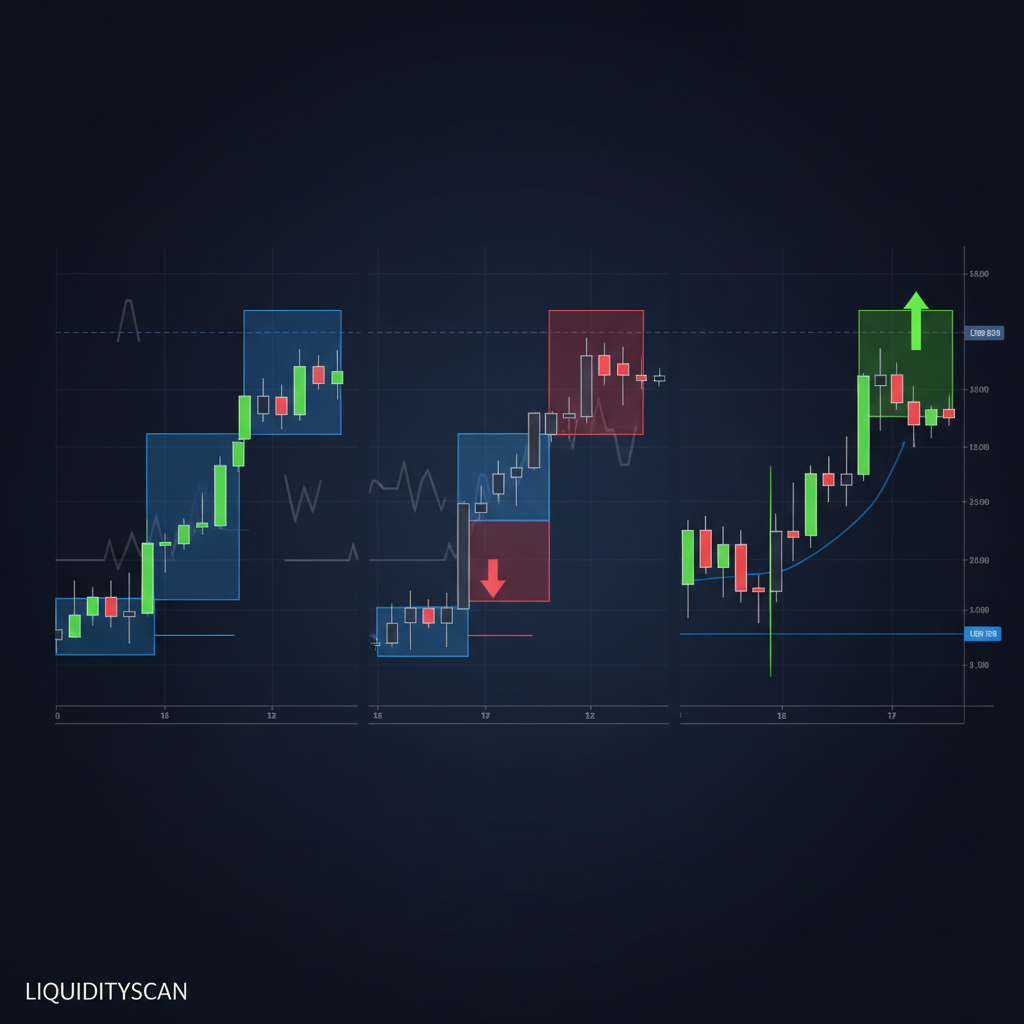
3 High-Probability Order Block Entry Models
Three order block entry models with defined triggers, invalidation, and confluence — no discretion, just rules you can backtest and repeat.
Hayk Muradian·
·5 min
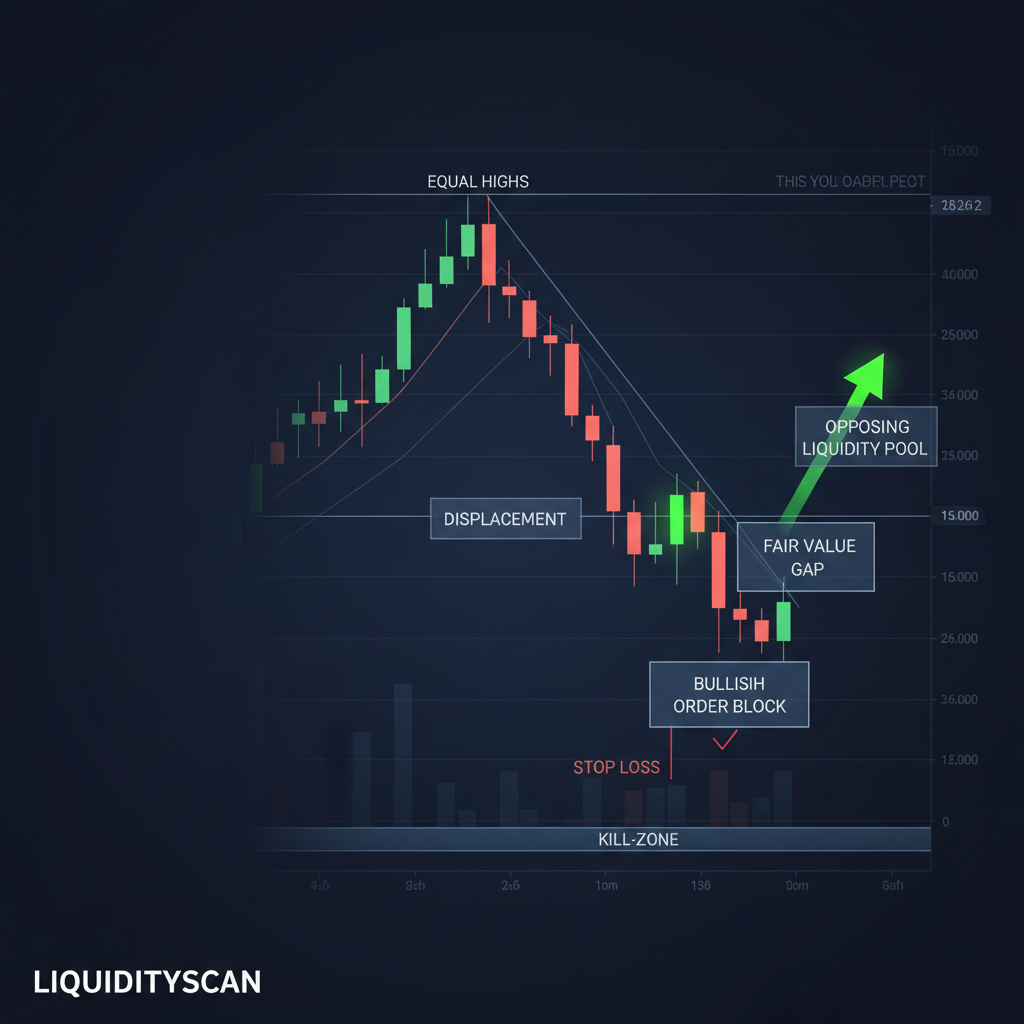
What Is the ICT Trading Strategy? A Methodology Guide
ICT isn't a single setup. It's a repeatable method for reading where institutions push price next — bias, liquidity, arrays, time, entry.
Hayk Muradian·
·5 min
Stop-Loss Hunting Explained: Is It Real and How to Avoid Getting Swept
Yes, stop-loss hunting is real, but not because anyone is watching your order. Price gravitates to where stops cluster because large orders need that resting liquidity to fill. Here is how to place stops that survive.
Hayk Muradian·
·10 min
The Liquidity Sweep into OTE: A Classic ICT Reversal Setup
The liquidity sweep into OTE is one of ICT's cleanest reversals: price runs a liquidity pool, reverses, then retraces into the 62-79% Optimal Trade Entry zone of the new impulse leg. You enter at a deep discount or premium with the sweep as confluence and invalidation.
Hayk Muradian·
·10 min
The A+ Setup: Order Block + FVG Confluence Strategy
The strongest ICT entries occur where an Order Block and a Fair Value Gap overlap. The OB marks the institutional origin; the FVG marks the precise imbalance to fill. Together they stack into one tight, high-confluence entry zone.
Hayk Muradian·
·10 min
The Art of Confluence: Stacking Edges for High-Probability ICT Setups
SMC confluence trading is the practice of stacking multiple independent edges — bias, location, a liquidity sweep, a structure shift, a PD-array entry, timing — at the same price and time, so no single weak signal decides the trade.
Hayk Muradian·
·10 min
How to Map Market Structure Top-Down: A Step-by-Step Method
To map market structure, work top-down: mark the HTF swings first, read the trend, find the dealing range and draw on liquidity, then drop to the LTF only around your point of interest. HTF sets bias; LTF times entry.
Hayk Muradian·
·10 min
How Many Losses in a Row Is Normal? Losing-Streak Probability Explained
Long losing streaks are not a broken edge — they are guaranteed by probability. A 50%-win system over 200 trades will likely hit a 7-plus streak; a 40%-win system should expect 10. Here is the math, and how to survive it.
Hayk Muradian·
·11 min
How to Trade the Power of Three on the Daily Candle
To trade the Power of Three on the daily candle, anchor to the daily open, wait for the manipulation leg to sweep liquidity against your HTF bias, then enter on the reversal back through the open toward the opposite draw on liquidity.
Hayk Muradian·
·10 min
The Universal ICT Entry Checklist: One Framework for Every Model
Every clean ICT entry passes the same seven checks, no matter the model. This universal ICT entry checklist turns bias, location, liquidity, time, confirmation, risk, and invalidation into a fast pre-trade filter that kills impulsive trades before they cost you.
Hayk Muradian·
·10 min
The 'One Setup' Strategy: How to Master a Single ICT Model for Consistency
A one setup trading strategy means specializing in a single, mechanically defined ICT model and trading it hundreds of times until you know its every nuance. Depth beats breadth: one setup traded 500 times builds an edge that ten setups traded 50 times each never will.
Hayk Muradian·
·10 min
Which ICT Model Should You Trade? A Decision Framework
The right ICT model is the one that fits your schedule, market, and temperament — not the one with the loudest hype. Pick by constraint, master one to consistency, then add.
Hayk Muradian·
·10 min
Risk-to-Reward vs Win Rate: Which Matters More for Profitability?
Win rate vs risk reward is a false choice. They multiply into one number, expectancy, and profitability lives there. But for most retail traders, raising average R is easier and more robust than lifting win rate.
Hayk Muradian·
·10 min
What Is Drawdown in Trading and How to Recover From It
Drawdown is the peak-to-trough decline in your account equity, measured as a percentage. The deeper it gets, the more asymmetric the recovery: a 50% drawdown needs a 100% gain just to break even.
Hayk Muradian·
·10 min
What Is Trading Expectancy and How Do You Calculate It?
Trading expectancy is the average amount you can expect to win or lose per trade over a large sample. Positive expectancy means an edge; win rate alone tells you almost nothing.
Hayk Muradian·
·10 min
What Is a Good Risk-to-Reward Ratio for ICT Trades?
There is no universal "good" risk-to-reward ratio. What matters is pairing R:R with your real win rate to get positive expectancy. ICT setups typically aim 1:2 to 1:5 because structural stops make asymmetric payoffs possible.
Hayk Muradian·
·10 min
Not trading advice. LiquidityScan publishes educational content for informational purposes only. Trading involves substantial risk of loss.