What an RSI overbought and oversold scanner shows you
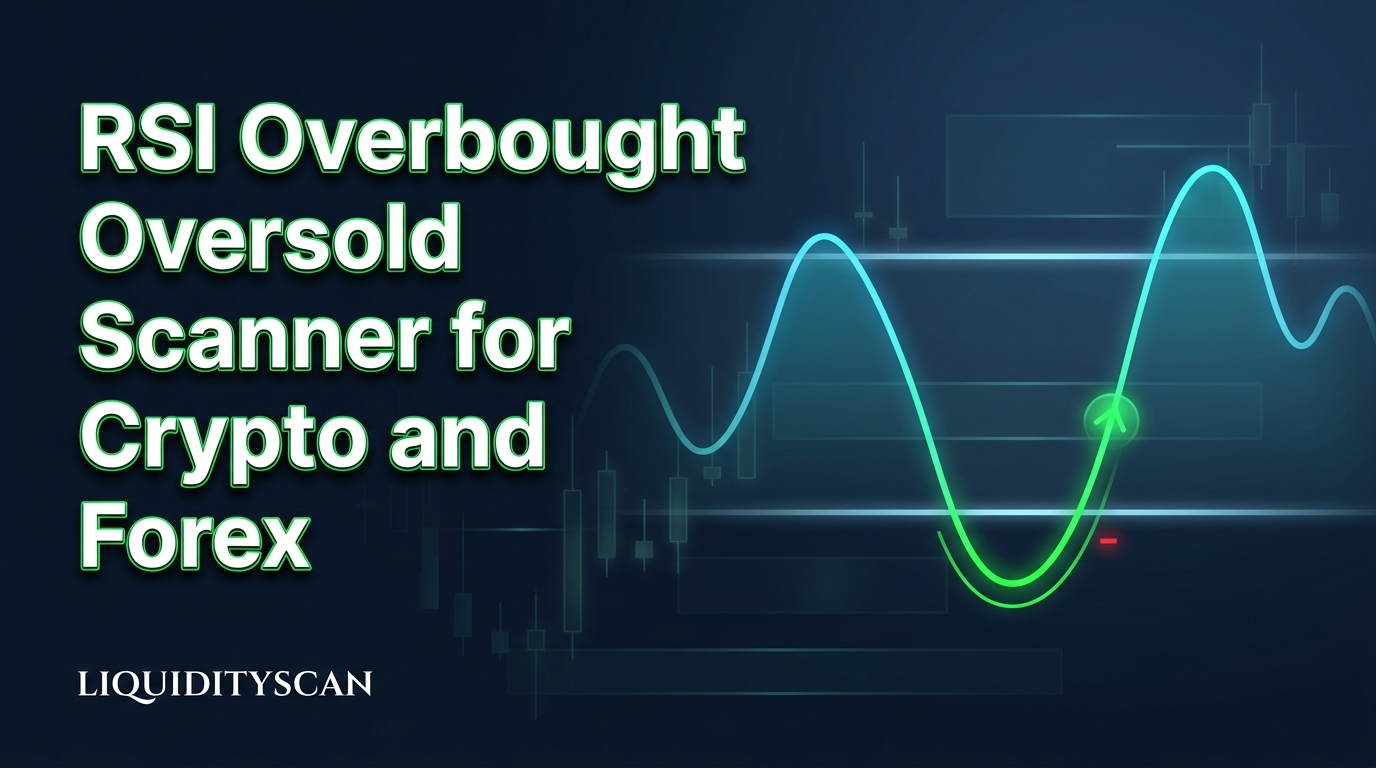
An RSI overbought/oversold scanner checks the Relative Strength Index on every market it covers and lists the ones where RSI has closed in an extreme: at or below 30 (oversold) or at or above 70 (overbought). On LiquidityScan that job belongs to the RSI Levels scanner. It reads closed candles on the 1H, 4H, 1D, 1W and 1M timeframes across crypto, forex and TradFi markets, and it is one of the eight classic scanners that are free to read.
The list is a map of where price is stretched. It does not tell you a reversal has started. The event worth waiting for is the cross back out, the close that takes RSI back above 30 or back below 70, and even that needs price to agree. Below: how the scanner defines each event, how to use it step by step, and where the reading misleads.
How RSI Levels defines oversold and overbought
RSI weighs recent up-closes against recent down-closes and prints the balance on a scale from 0 to 100. The scanner uses the standard 14-candle setting. A reading near 30 means down-closes have heavily outweighed up-closes over the last 14 candles. Near 70 is the mirror.
The scanner turns that into two signals, each with a defined start and end:
| Event | Oversold | Overbought |
|---|---|---|
| Signal starts | RSI closes at or below 30 after being above it | RSI closes at or above 70 after being below it |
| Signal ends | RSI closes back above 30 | RSI closes back below 70 |
| What it says about price | Down-closes have dominated the last 14 candles | Up-closes have dominated the last 14 candles |
| What it does not say | That a low is in | That a high is in |
| Price evidence to wait for | A sweep of a prior low, then a close back above the origin of the last down-run | A sweep of a prior high, then a close back below the origin of the last up-run |
| The idea is wrong if | A candle closes below the low made during the extreme | A candle closes above the high made during the extreme |
Each signal carries the RSI value at the crossing candle next to the level it crossed, written like 27.4 / 30. That number tells you how hard the market closed into the zone. A 29.8 barely qualified. A 21 arrived after a far more one-sided run.
Two details matter. First, after being above it means the signal marks the candle where RSI arrives in the zone, not every candle it spends there. Second, detection happens on closed candles only. If RSI dips to 29 while a 4H candle is forming and that candle closes with RSI at 31, nothing is reported. This removes the intrabar flicker that makes live RSI alerts noisy, at the cost of waiting for the close. The guide to candle close confirmation explains why a forming candle and a closed one are different pieces of information.
Why the cross back out matters more than the extreme
Picture a 4H chart in a selloff. A candle closes with RSI at 28.6 and the oversold signal starts. Price grinds lower over the next four candles, with RSI printing 24, 22, 25 and 23. The market has fallen the whole time the signal was live. A trader who treated the first close under 30 as a reason to buy sat through that entire leg.
Then an up candle closes with RSI at 31.4 and the signal ends. That close says something specific: enough buying showed up in the latest candles to pull the 14-candle balance out of the extreme. It does not say buyers are in control. One strong up candle inside a downtrend can do the same thing.
So read the two states differently:
- Signal live: the market is stretched and still inside the zone. This is a watch list, not a trigger.
- Signal ended: RSI has closed back out. Momentum has stopped getting worse. Now look at price.
What price has to show next is a change in who controls the candles. For an oversold market, the evidence ICT traders look for is a sweep of a prior low (a wick below the level that closes back above it, covered in what a liquidity sweep is), followed by a CISD. CISD stands for Change in State of Delivery: a candle closes back beyond the level where the last run of candles into the swing low began. The article on what CISD means in ICT trading walks through that level candle by candle.
Invalidation comes from price, not from RSI. The lowest low printed while the signal was live is the reference. If a later candle closes below it, the idea that selling was exhausted is wrong, whatever RSI reads. And if RSI closes at or below 30 again, a new oversold signal starts and you are back to watching. Flip every statement for overbought.
How to scan for RSI extremes on LiquidityScan, step by step
Pages inside the app need a free account, and sign-up asks for no card. RSI Levels belongs to the Free plan, with no time limit on reading it.
- Open the scanner. Go straight to RSI Levels, or pick it from All Scanners, where all 15 scanners sit on one page with live counts.
- Pick the market mode. The app has three: Crypto (perpetual contracts), Forex (72 instruments: majors, crosses, exotics and metals such as XAU/USD) and TradFi (stocks, indices and commodities). RSI Levels runs in all three.
- Pick a timeframe. The scanner covers 1H, 4H, 1D, 1W and 1M. It has no 5m or 15m. On LiquidityScan only the Fair Value Gaps and CISD+ scanners have those two timeframes, on the Base plan and above, so do not treat this as a scalping screen.
- Read each signal. You get the market, the side (oversold or overbought) and the RSI value against the level, such as 27.4 / 30 or 73.1 / 70.
- Star what you want to follow. Starring a market on a scanner page adds it to your watchlist, which collects that market's signals from every scanner. The Free plan has one watchlist of five markets.
- Check the market across the other scanners. X-Ray looks up one market across every scanner. Free includes one X-Ray a day.
Reading the scanner is free on every plan. Alerts on the eight classic scanners start on the Starter plan and arrive by browser push, Android push or the in-app bell. There is no Telegram delivery. In My Alerts you choose the scanner, the markets and the timeframes, and alerts are bundled so they do not flood you. The guide on setting alerts by pattern, market and timeframe covers how to keep that list short.
On Free you still have price alerts with browser push. They fit the invalidation level described above: mark the low made during an oversold signal and you will know when price gets there without watching the chart.
LiquidityScan is software, not a signal service. A row on this scanner is a measured condition on a closed candle, and the decision stays with you.
Which timeframe to read first
How ordinary an extreme is depends on the timeframe. On 1H, RSI visits 30 or 70 routinely during any directional session. In one verified week, forex alone produced 334 RSI Levels signals on LiquidityScan. A reading that common cannot be a reason to trade by itself.
Work from the top down. A weekly or monthly reading is context: it tells you where the market sits in its larger swing and can stay relevant for many candles. A daily reading frames the week. 4H and 1H readings are timing inside that frame.
The combination to look for is a lower-timeframe extreme that points back toward the higher-timeframe direction. Take a 1H oversold signal on a market whose daily candles are still closing above prior highs: that is a pullback inside an up-leaning market. The opposite case, 1H oversold while daily candles keep closing below prior lows, is simply what a downtrend looks like on RSI. The daily bias scanner guide shows how that higher-timeframe lean is read from closed candles.
What to pair an RSI extreme with
An extreme answers one question: is this market stretched? Three other scanners answer the questions that come next.
- RSI Divergence. A bullish divergence is a lower low in price with a higher low in RSI. LiquidityScan's divergence scanner also requires the first RSI low to be below 30 (and the first high above 70 for the bearish case), so every divergence it reports begins with a visit to the zone. The difference between the types is explained in regular vs hidden RSI divergence.
- A price pattern on the same timeframe. A CISD or a CRT (Candle Range Theory: a candle pokes past an earlier candle's high or low, then closes back inside its range) while RSI is stretched is a stronger read than either alone.
- Pulse. This filter does that pairing for you. It takes signals from six scanners (SuperEngulfing, CISD, CRT, Bias, 3-OB and CISD + IFVG) and passes only those RSI also confirms. Standard mode needs RSI to have touched the zone recently. Strict mode needs RSI inside the zone at the close of the signal candle. Oversold confirms longs only, overbought confirms shorts only. Pulse starts on the Starter plan, and RSI confirmation for ICT signals covers both modes in detail.
Where RSI extremes mislead
- Trends pin RSI. In a strong uptrend RSI can close above 70, slip back into the 60s and close above 70 again several times while price keeps making higher highs. Each visit is a fresh overbought signal and none of them is a top.
- 30 and 70 are conventions. No orders rest at an RSI value. Stops and liquidity sit at price highs and lows, which is why the sweep matters more than the number.
- RSI gives no stop and no target. The scanner reports a condition. Your levels have to come from the chart: the swing made during the extreme, the range above or below it. Once you have a stop distance, the position size calculator walkthrough shows how to turn it into a size.
- Thin markets distort it. Forex exotics have wide spreads and gappy prices, and one gap candle can throw RSI into an extreme. LiquidityScan keeps exotics on a separate tab and leaves them out of alerts unless you pick them. Why exotics behave differently from majors and crosses goes deeper.
- The cross back out can fail. RSI closes at 31, the signal ends, and two candles later it closes at 29 again. That is why the exit from the zone starts the analysis and does not finish it.
Frequently Asked Questions
What RSI settings does the RSI Levels scanner use?
A 14-candle RSI with 30 as the oversold level and 70 as the overbought level. An oversold signal starts when RSI closes at or below 30 after being above it and ends when RSI closes back above 30. Overbought is the mirror at 70.
Is the RSI overbought/oversold scanner free?
Yes, to read. RSI Levels is one of the eight classic scanners on the Free plan, on 1H, 4H, 1D, 1W and 1M, with no card and no time limit. Alerts on the classic scanners start on the Starter plan.
Does it scan forex pairs and gold, or only crypto?
All three market modes. Forex covers 72 instruments, including the seven majors and metals such as XAU/USD and XAG/USD. Crypto covers perpetual contracts, and TradFi covers stocks, indices and commodities. All 15 scanners run in each mode.
Is an oversold reading a buy signal?
No. It means down-closes have dominated the last 14 candles. In a downtrend RSI can stay at or below 30 while price keeps falling. Wait for RSI to close back above 30, then for price evidence such as a sweep of a low followed by a CISD. If price then closes below the low made during the extreme, treat the idea as invalid.
Can I scan RSI on 5-minute or 15-minute charts?
Not with RSI Levels. It runs from 1H to 1M. On LiquidityScan only the Fair Value Gaps and CISD+ scanners have 5m and 15m, on the Base plan and above.
What is the difference between RSI Levels and RSI Divergence?
RSI Levels reports that RSI has closed into an extreme and when it has closed back out. RSI Divergence reports a disagreement between two swings: price makes a lower low while RSI makes a higher low, or the reverse at highs. The first is a condition. The second compares two moments in time.
Related reading
- RSI Confirmation for ICT Signals: How to Filter CISD, CRT and Engulfing Setups With RSI — how the Pulse filter combines an RSI extreme with a price pattern.
- How to Spot RSI Divergence Across Hundreds of Pairs — the natural next step once a market has been in the zone.
- ICT Daily Bias Scanner: Bullish or Bearish Bias for Every Market Before the Session — the higher-timeframe lean that tells you which extremes to care about.