What RSI confirmation means for an ICT signal
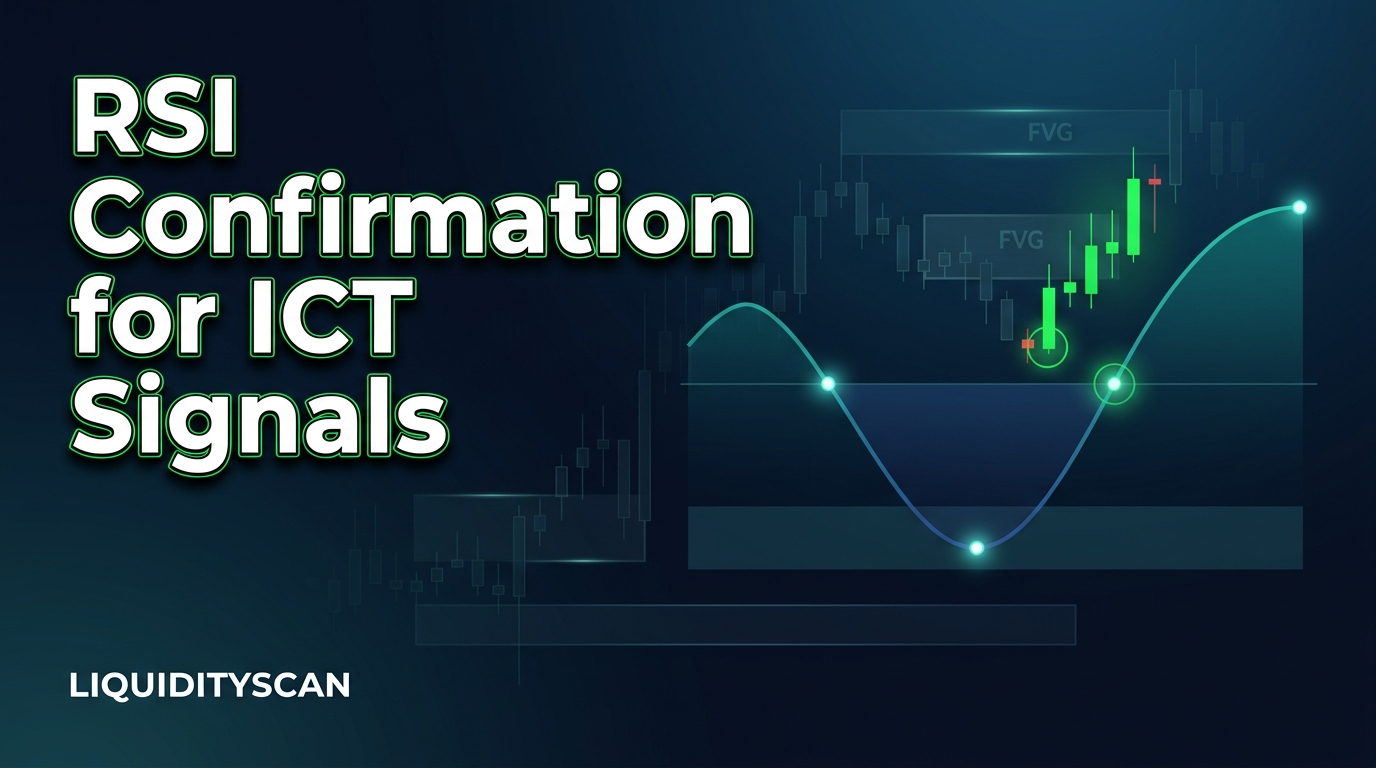
RSI confirmation is a second condition placed on a price signal. You accept a bullish signal only if the Relative Strength Index (RSI, a momentum oscillator, here calculated over 14 candles) was recently oversold, and a bearish signal only if RSI was recently overbought. The price pattern says something turned. RSI says the move that turned was already stretched. Together they describe a reversal that printed at the end of a one-sided run instead of in the middle of a range.
ICT triggers need that kind of filter because they fire often. A CISD, or Change in State of Delivery, is a close back through the level where the last run of candles into a swing began. A CRT (Candle Range Theory) setup is a wick beyond an earlier candle's high or low that closes back inside that candle's range. A reversal engulfing candle runs past the previous candle's extreme and closes on the other side of its open. All three appear in dead ranges as well as at real turning points. RSI confirmation shortens the list with a rule you can state in one sentence. It does not make any single signal safe, and it throws away some that would have worked.
Why a stretched RSI belongs with a sweep-and-reverse pattern
Picture a 4H chart that has sold off for ten candles. RSI has dropped under 30, the conventional oversold line. The next candle wicks below the low of an earlier, larger candle, where sell stops rest, and closes back inside that candle's range. That is a bullish CRT. The oversold reading adds one fact: the sweep came at the end of a sustained push, when the sellers who drove it had already done most of their selling.
Now put the identical candle in the middle of a sideways week with RSI at 48. The wick and the close are the same, but there was no one-sided move to exhaust, so there is less reason to expect a reversal of any size.
Direction is part of the rule. Oversold supports longs only and overbought supports shorts only. A bearish CISD printed while RSI is oversold is not confirmed. It is a sell signal arriving after the selling is already stretched.
The timing problem: RSI moves on the signal candle
The signal candle changes RSI. A bullish CISD only exists once a candle closes back above the level where the final down-leg began. That close is a strong up-candle, and a strong up-candle lifts RSI. On the candle that confirms the pattern, RSI has often already left the oversold zone. If you demand an oversold reading on the signal candle itself, you reject many reversals at the moment they prove themselves. If you demand nothing about timing, an oversold touch from weeks ago still counts. Two definitions solve this in different ways.
| Touched recently (Standard) | Still inside (Strict) | |
|---|---|---|
| RSI condition | Reached the oversold zone (for a long) or overbought zone (for a short) within a look-back window, and has not crossed 50 since | Inside the zone at the close of the signal candle |
| What it looks like | RSI dips to 28, lifts, and a few candles later a bullish CISD closes | RSI reads 24 on the close of a bullish CRT candle |
| How many signals | More | Fewer; every Strict signal also qualifies as Standard |
| Main weakness | Part of the bounce may be spent before the signal closes | Momentum has not turned yet, and in a strong trend RSI can stay in the zone |
Both definitions need an expiry, and the midline is a sensible one. If RSI climbs back through 50 between the oversold touch and the signal, the stretched condition is over: momentum has reset to neutral or flipped. A bullish pattern printing after that is a new event in a market that has already recovered, so the earlier touch no longer counts.
You can apply either rule by hand. Add RSI(14) to the chart on the signal's timeframe, find the signal candle, and look left for the last visit to the zone and any cross of 50 after it. The RSI overbought and oversold scanner lists the markets sitting at an extreme, which is where the next confirmed signal can come from.
What the RSI check adds to each setup
- CISD. With RSI confirmation a bullish CISD reads as: a stretched sell-off ended and delivery flipped. On LiquidityScan a CISD is a chart marker with no entry, stop or targets, so the RSI check only narrows where you look.
- CRT. The sweep is the point of the pattern. An oversold reading says the sweep came after a real push down, not a drift. The guide to trading CRT highs, lows and the midpoint entry covers what to do after the close back inside.
- Engulfing. An engulfing candle with nothing stretched behind it is common. When an engulfing candle matters is mostly a question of what came before it, and RSI is one mechanical answer.
- Bias. A bullish bias prints when a candle closes above the previous candle's high. Paired with a recent oversold reading it marks the first upside close after stretched selling. The daily bias scanner guide explains how the bias itself is read.
- CISD + IFVG. This is a CISD that fires while a same-direction inverse fair value gap is active. An inverse FVG is a gap price closed straight through, so it now acts the other way. It is already the narrower CISD, and RSI narrows it again. See the CISD + IFVG reversal pattern.
- 3-OB. Three stacked order blocks are a continuation pattern, so an RSI extreme is an unusual partner: it keeps only continuations that begin from a stretched reading. Treat this pairing as optional.
How to filter signals by RSI on LiquidityScan with Pulse
Pulse is the part of LiquidityScan that runs this check for you. It is not a sixteenth scanner and it detects no pattern of its own. It takes signals that six scanners have already produced on closed candles (SuperEngulfing, CISD, CRT, Bias, 3-OB and CISD + IFVG) and passes only those that RSI(14) on the same timeframe confirms. Pages inside the app need a free account. Pulse itself, feed and alerts, belongs to the Starter plan and every plan above it.
- Open the Pulse feed. Every entry is a scanner signal that fired on a closed candle and passed the RSI check. Oversold readings back longs only and overbought readings back shorts only, so you will not see a short confirmed by an oversold RSI.
- Read the RSI line on the signal. It tells you which case you are looking at. Either RSI was inside the zone at the close, shown with the reading, or RSI reached the zone earlier and has not crossed 50 since, shown with the extreme it reached and the value at the close. That is Strict versus Standard in one line. Every Pulse signal is evaluated against both.
- Decide on the kill-zone switch. A kill zone is a window of the day when session activity concentrates. With the switch on, the feed keeps only 1H and 4H signals from 12:00–16:00 UTC. It has no effect on daily and weekly signals, because those candles span the whole window anyway.
- Open the source signal. Pulse re-checks a signal and does not replace it. The scanner's own page holds the levels and context for that pattern.
- Check the Pulse rules page. It lists the RSI bounds and look-back windows currently enforced for each scanner and timeframe. They are not one fixed pair of numbers: defaults differ by timeframe because extremes are more frequent on shorter ones. Read this page before assuming 30 and 70.
- Set alerts if you want them. Pulse alerts are part of Starter. CISD and CISD + IFVG are configured together, with a choice between all CISD signals and only those that also have the inverse FVG. 3-OB is opt-in and off by default. Delivery is browser push, Android push and the in-app bell, and alerts are bundled so they do not flood. The guide to choosing alerts by pattern, market and timeframe covers the rest.
Pulse leaves two things out. It does not filter the Order Blocks (OB+) or Fair Value Gaps scanners, so the feed will not show you an RSI-confirmed order block. It also leaves out RSI Divergence, because that scanner already has RSI in its definition. If divergence is what you want, read how regular and hidden RSI divergence differ.
Where RSI confirmation fails
- Strong trends pin RSI. In a hard sell-off RSI can sit in the oversold zone for many candles. Every small bounce pattern then counts as confirmed, and the early ones get run over. Strict mode is the most exposed, since still inside the zone also means momentum has not recovered at all.
- It removes valid continuation entries. In a healthy uptrend, pullbacks rarely reach oversold. A bullish CISD at the end of such a pullback will not pass, and that says nothing bad about it. An unconfirmed signal is not a rejected signal.
- It is not independent evidence. RSI is computed from the same closes that formed the pattern. It summarises the prior move and adds nothing from outside the chart.
- It sees one timeframe. The check uses RSI on the signal's own timeframe. It knows nothing about higher-timeframe bias, where liquidity sits or whether price is at a higher-timeframe zone. Pair it with a top-down read, for example setups that agree on 4H, daily and weekly.
- It is not an entry or a stop. You still need your own invalidation. For a long off a sweep that is usually the swept low: if price closes back below it, the idea is wrong whatever RSI read.
This article quotes no hit rates for either mode, on purpose. Use RSI confirmation to decide which signals get your attention first. It cannot tell you how a trade will end.
Frequently Asked Questions
What is RSI confirmation in trading?
It is a rule that accepts a price signal only when RSI agrees: recently oversold for a long, recently overbought for a short. It confirms that the prior move was stretched. It does not confirm that the reversal will follow through.
Does RSI have to be oversold on the exact candle of the signal?
No. The signal candle is usually a strong close in the new direction, which pulls RSI out of the zone. One workable rule accepts a recent touch as long as RSI has not crossed 50 since. Requiring RSI inside the zone at the signal candle's close is the stricter version and gives fewer signals.
Which signals does Pulse check against RSI?
Signals from six scanners: SuperEngulfing, CISD, CRT, Bias, 3-OB and CISD + IFVG. It does not filter Order Blocks (OB+) or Fair Value Gaps, and RSI Divergence is excluded because RSI is already part of that pattern.
Is Pulse available on the free plan?
No. Pulse, both the feed and its alerts, starts on Starter. On Free you can read the eight classic scanners, which include CISD, CRT, SuperEngulfing and RSI Levels, and compare a signal with RSI by hand.
Can I use RSI confirmation on continuation setups?
You can, but it fits poorly. Pullbacks inside a trend seldom reach an RSI extreme, so most continuation signals will not pass. That is why 3-OB in Pulse is opt-in and off by default.
Related reading
- Scanner, Pulse and Core Layer: The Three LiquidityScan Surfaces — where Pulse sits next to the raw scanners and the multi-timeframe layer.
- ICT Kill Zones: The Complete Guide — the session windows behind the kill-zone switch.