What a multi-timeframe CISD is
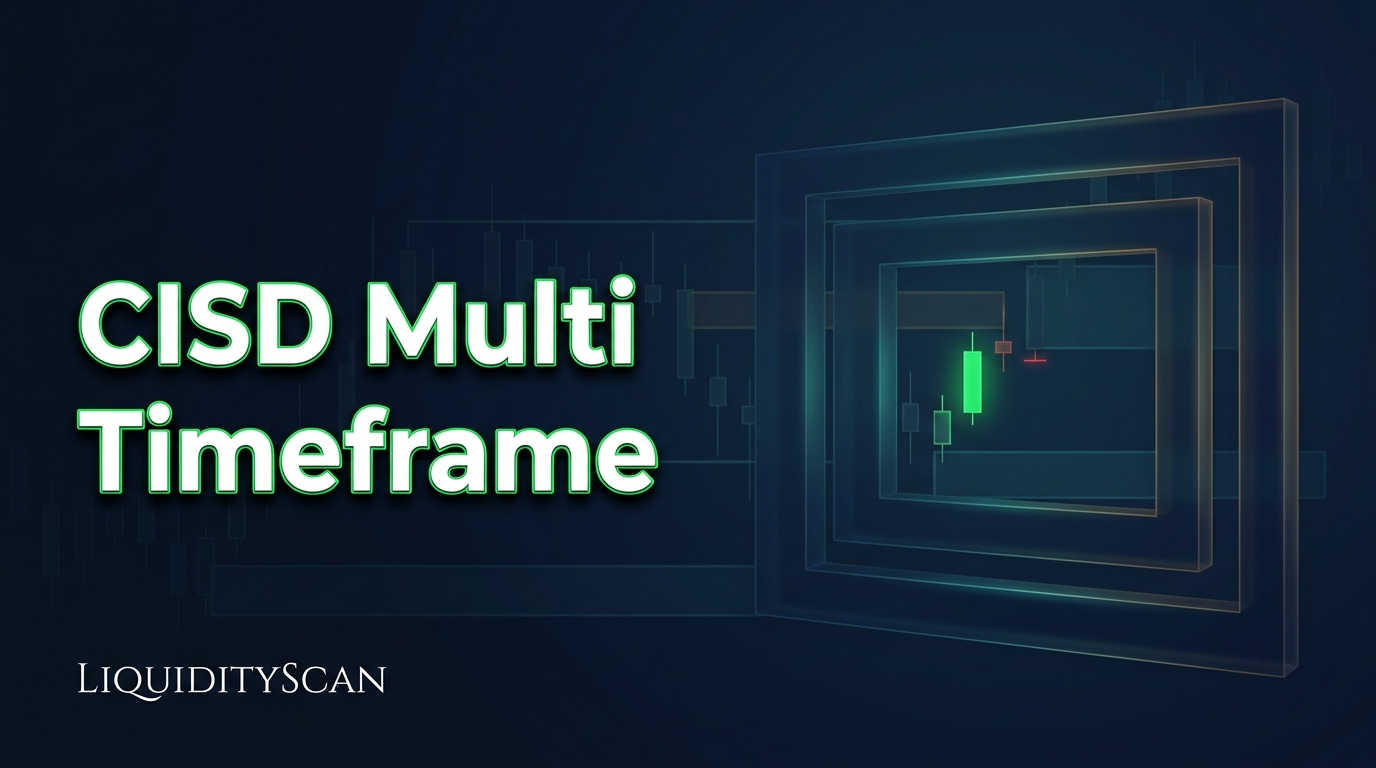
A multi-timeframe CISD is a lower-timeframe change in state of delivery that forms inside the price range of an earlier higher-timeframe CISD, with both pointing the same way. The higher timeframe shows where delivery flipped. The lower timeframe shows the same flip repeating on a smaller scale while price pulls back into that area, which gives a closer invalidation level than the higher timeframe offers on its own. LiquidityScan detects this nested structure with a dedicated scanner called CISD+. This article covers the price logic and how to read that page.
CISD (Change in State of Delivery) is a concept from ICT (Michael J. Huddleston): price is delivered one way by a run of same-direction candles, then a candle closes back beyond the point where that run began. If the single-timeframe idea is new to you, read what CISD means in ICT trading first.
One CISD first: the level, the pivot and the range
Take the bullish case. Price drops into a swing low through a run of consecutive down-close candles. Often that low is a sweep, a wick that runs below an earlier low to take the stops resting there. Mark the price where that run of down candles began. When a later candle closes above that price, sellers have lost control of delivery and the bullish CISD is confirmed. The bearish version is the mirror: a run of up-close candles into a swing high, then a close back below where the run began.
Every CISD gives you three things:
- The level: where the run began. LiquidityScan labels it MSS, short for market structure shift (a close through a level that flips short-term structure). Many traders treat the two ideas separately, and CISD vs market structure shift explains what each one confirms.
- The pivot: the swing low (or high) the run ended at. This is the invalidation.
- The range: everything between the level and the pivot. If the flip is real, a retracement should hold somewhere inside it.
Nesting is built entirely from these ranges.
How a lower-timeframe CISD nests inside a higher-timeframe one
Picture a daily chart with made-up prices. A run of red daily candles starts at 104, sweeps an old low and bottoms at 96. Two days later a daily candle closes above 104. That is a bullish daily CISD with a range from 96 to 104.
Price rarely leaves in a straight line. It drifts back into the range, and on the 1H chart that drift looks like a small downtrend: a run of red hourly candles starts at 101.5 and bottoms at 99.2. Then an hourly candle closes above 101.5. That is a bullish 1H CISD, and its range sits wholly inside the daily range. You now have a two-member nest.
It can repeat once more. Price dips back into the hourly range, a run of red 5m candles starts at 100.9 and bottoms at 100.3, and a 5m candle closes above 100.9.
| Member | Level (where the run began) | Pivot (invalidation) | What losing the pivot means |
|---|---|---|---|
| Daily anchor | 104 | 96 | The idea is over. Nothing is left to nest inside. |
| 1H | 101.5 | 99.2 | The hourly flip failed. The daily range may still hold. |
| 5m | 100.9 | 100.3 | The tightest trigger failed. The two larger ranges are untouched. |
Two conditions separate a nest from a coincidence. The members must point the same way: a bearish 1H CISD inside a bullish daily range is a pullback still in progress, not confirmation. And the smaller range must sit inside the larger one. A bullish hourly CISD that prints above 104, after price has already left the daily range, is a continuation signal with a different risk picture.
What nesting gives you, and what it costs
The daily CISD alone has an awkward problem: its invalidation is 8 points away at 96. A trader who waits for the hourly member can define risk against 99.2 instead, or against 100.3 with the 5m member, while still leaning on the daily context. That is the whole appeal: a higher-timeframe reason with lower-timeframe risk.
The cost is that a tight pivot is easy to take out. Price can wick through 100.3, drop the 5m member, hold 99.2 and still rally. The daily idea was right and the tightest version of it still lost. Nesting does not remove that trade-off. It lets you choose where on it to stand. Whichever pivot you treat as your invalidation is the one to size against, which is the job of a position size calculator.
The nest also says nothing about where price is heading. A target has to come from somewhere else, usually a draw on liquidity (the pool of resting stops price is most likely reaching for) beyond the range. For how traders act on a single flip, see the CISD entry model.
How to find nested CISDs on LiquidityScan with the CISD+ scanner
Doing this by hand means tracking three timeframes per market and re-checking after every close. The CISD+ scanner does it across crypto, forex and TradFi markets, because all 15 scanners run in all three market modes. Pages inside the app need a free account, which you can create at liquidityscan.io/register. LiquidityScan is software, not a signal service: a detection is context for your own decision.
- Open the scanner. Go to the CISD+ page directly, or start from All Scanners, where each of the 15 cards shows a live count and how the pattern works. CISD+ is one of the seven premium scanners. On the Free plan you see its live count but not the setups. Starter opens all 15 scanners to browse.
- Know the ladder. The product describes CISD+ as two or more CISDs nested down a fixed ladder: daily, then 1H, then 5m; or weekly, then 4H, then 15m. Most LiquidityScan scanners work on 1H, 4H and 1D (plus 1W). Only Fair Value Gaps and CISD+ also have 5m and 15m, and those two intraday timeframes belong to the Base plan and above.
- Read the ranges. Each member's range spans its CISD's MSS level to the swept pivot, the same level-to-pivot range described above. A valid nest is a lower-timeframe CISD inside a same-direction higher-timeframe one.
- Check the grade. Nests are graded CISD+ or CISD++. The top grade, CISD++, is part of the Pro plan. A grade describes the nest and is not a forecast. How to grade a trade setup covers how to weigh grades across scanners.
- Wait for the retrace. The scanner's own description treats price retracing into a range as the entry area. Detection runs on closed candles only, so a member appears after the candle that closed beyond its level has finished. Price may already be away from the range when you first see the nest.
- Watch for the drop. A member is dropped once price trades through its pivot on the far side. The nest then either dissolves or drops a grade. If you open a nest that no longer exists, the page says it has dissolved or was not found.
- Set an alert instead of refreshing. In My Alerts you choose setups by scanner, market and timeframe. Delivery is browser push, Android push and an in-app bell. Alerts on CISD+ start on the Base plan, and the CISD++ grade belongs to Pro. How to set trading alerts that don't spam you shows how to narrow them.
For a single-timeframe view, the classic CISD scanner is free to read. It marks each signal's MSS level and FIB, the halfway point between that level and the swing.
When a nested CISD fails, and what traders get wrong
- No retrace, no location. Strong moves leave the range and do not come back. The nest exists, but price never offers the range again. Chasing above the level changes the risk completely.
- The members are not independent. An hourly CISD inside a bullish daily range is partly the same bounce seen at a finer scale. Three timeframes agreeing is alignment, not three separate pieces of evidence.
- The anchor can be wrong. A bullish daily CISD against a weekly downtrend is a counter-trend bounce until proven otherwise. In a sideways market CISDs fire in both directions and nests form and dissolve repeatedly. Fractal market structure explains why the timeframe above your anchor still matters.
- Location inside the anchor matters. An hourly member near the top of the daily range leaves a long way down to the daily pivot if it fails. ICT traders usually prefer longs from the lower half of the range.
- Thin markets distort small pivots. On 5m and 15m a single wide wick can trade through a pivot. Forex exotics have wide spreads and gappy prices, which is why LiquidityScan keeps them on a separate tab.
- CISD+ is not CISD + IFVG. The similarly named classic scanner pairs a CISD with an inverse fair value gap (a three-candle gap that price closed straight through, so it now acts the other way). That one is covered in the CISD + IFVG reversal pattern.
Frequently Asked Questions
What is a multi-timeframe CISD?
It is a lower-timeframe CISD whose range, from its level to its pivot, sits inside the range of a higher-timeframe CISD in the same direction. The higher timeframe supplies the context and the lower timeframe supplies a closer invalidation.
Which timeframes does the CISD+ scanner nest?
The product describes a fixed ladder: daily, then 1H, then 5m; or weekly, then 4H, then 15m. The 5m and 15m timeframes belong to the Base plan and above.
What is the difference between CISD+ and CISD++?
They are the two grades the scanner gives a nested CISD. CISD++ is the top grade and is part of the Pro plan. When a member is dropped, a nest either dissolves or drops a grade. Neither grade is a probability.
When is a nested CISD invalidated?
A member is dropped once price trades through its pivot on the far side: below its swing low in a bullish nest, above its swing high in a bearish one. Losing the smallest member leaves the larger ranges standing. Losing the higher-timeframe anchor ends the idea.
Can I use the CISD+ scanner on the Free plan?
Free shows a live count for CISD+ but not the setups. Starter opens it to browse, Base adds the 5m and 15m timeframes and alerts, and Pro adds the CISD++ grade. The single-timeframe CISD scanner is free to read.
Does the CISD+ scanner cover forex and indices?
Yes. All 15 scanners run in the crypto, forex and TradFi modes. Forex mode has 72 instruments including the majors and metals, and TradFi mode includes indices such as the S&P 500 and Nasdaq 100.
Related reading
- Order Block Inside an Order Block: Lower-Timeframe Order Blocks Nested in a Higher-Timeframe Zone (MOB) — the same nesting idea applied to order blocks instead of delivery flips.
- Multi-Timeframe Scanner: Find Setups That Agree on 4H, Daily and Weekly — how timeframe agreement is tracked for other patterns.
- How to Scan for CISD (Change in State of Delivery) Setups — the single-timeframe scanner that each member of a nest comes from.
- ICT Top-Down Analysis: Stop Fighting the Chart — how to judge whether the higher-timeframe anchor deserves your trust.