What an order block inside an order block means
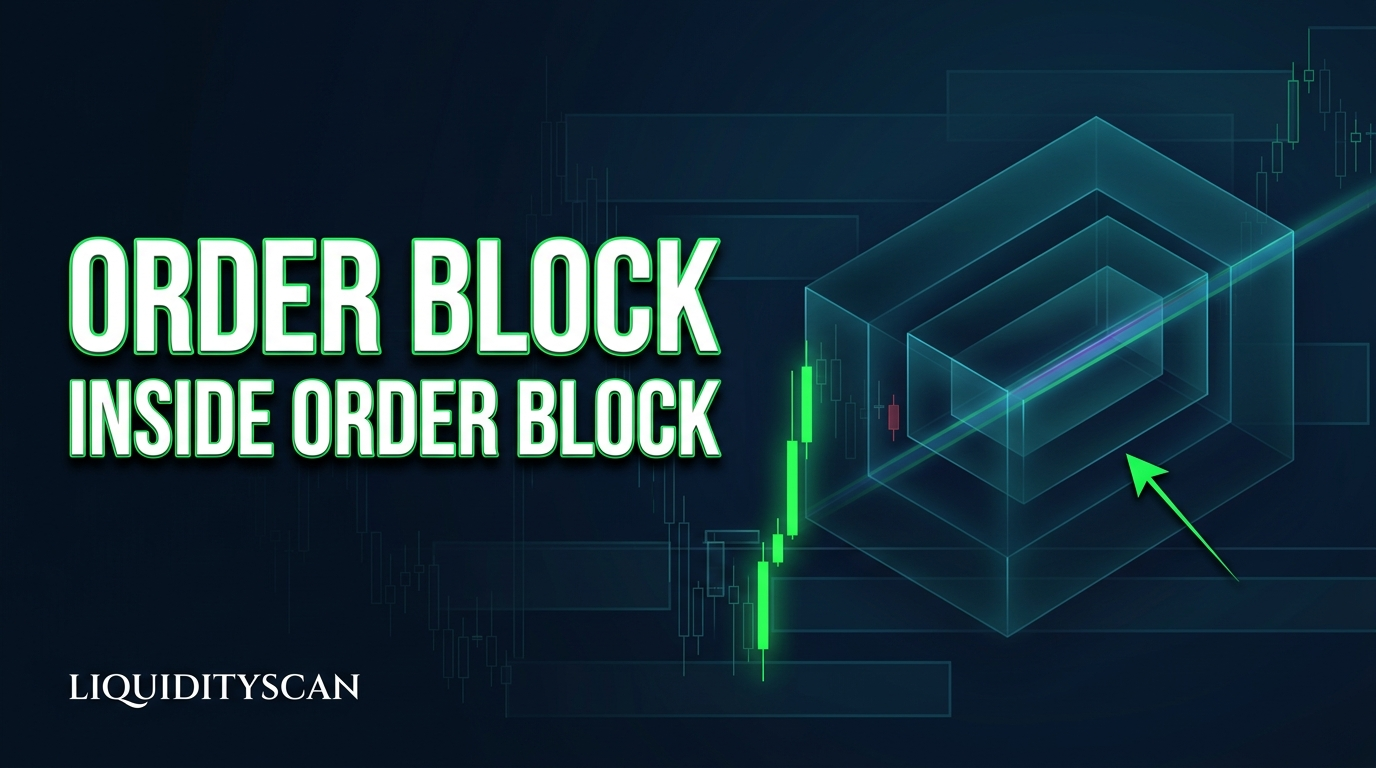
An order block inside an order block is a lower-timeframe order block whose range sits within a higher-timeframe order block that points the same way. The higher-timeframe block tells you which zone matters. The block inside it shows where in that zone price actually turned, and it gives you a narrower level that proves the idea wrong. On LiquidityScan this nest is called a Mega Order Block (MOB), and one scanner is dedicated to finding it.
A quick definition before going further. An order block, a concept from ICT (Michael J. Huddleston), is the last candle that closed against a move before price left with displacement, meaning a run of large one-directional candles, and broke a prior swing point. For a bullish block that is the last down-close candle before the rally. Its range is the zone traders watch when price comes back. If you have never marked one, read what an order block is and how to draw it first.
How the nest forms, candle by candle
Start on a daily chart. A down-close candle prints, and the next daily candles rally hard enough to close above the previous swing high. That close is a break of structure (BOS, a close beyond the last swing in the direction of the move). The down-close candle before the rally is the daily bullish order block. Mark its high and its low. This is the anchor.
Some days later price drifts back and trades into the anchor. Drop to the 4H chart and look only at the candles inside that daily range. Price pushes lower, prints a final 4H down-close candle, and then a 4H candle closes above that candle's high with displacement. That last down candle is a 4H bullish order block, and its whole range lies inside the daily one. Drop again to 1H and the same thing may have happened on a smaller scale inside the 4H block.
You now have three zones, each inside the next, all bullish: one anchor and two blocks within it. Flip every word for the bearish case: the last up-close candle before a sell-off, with lower-timeframe bearish blocks forming inside it when price returns from below.
There is a second way to arrive at the same picture. The daily candle that became the anchor is itself built from 4H and 1H candles, and somewhere among them is the lower-timeframe block the rally actually left from. Finding it is what traders mean by refining a higher-timeframe order block down to a tighter zone. Both routes rest on the same observation: market structure nests across timeframes, so a zone on one chart contains smaller zones on the chart below.
A manual check you can run on any chart
- Same direction. Every block in the nest is bullish, or every block is bearish. A bearish 1H block inside a bullish daily block is a conflict, not a nest.
- Fully inside. The inner block's high and low both sit within the anchor's range. A block that only overlaps the edge is a neighbour.
- A real step down in timeframe. Daily to 4H to 1H is a clear ladder. Two timeframes that are nearly the same show you the same candles twice.
- Each block earned its name. Price left each one with displacement and broke a swing on its own timeframe. A small pause inside a big zone is not an order block.
- The anchor is still fresh. A zone that price has already traded deep into several times has less left to defend. See how mitigated and unmitigated order blocks differ.
What has to happen next, and what ends the idea
A nest is a location, not a trigger. In the bullish case the read stays alive while price holds above the innermost block and lower-timeframe candles start closing above recent swing highs. The first objective most traders look at is the liquidity resting above the highs that formed while price was falling into the anchor.
- A candle close below the low of the anchor ends the whole idea. Nothing inside a broken anchor counts any more.
- A close below an inner block while the anchor still holds removes the refined level only. You are back to a plain higher-timeframe order block with a wider invalidation.
The rules behind both cases are covered in why order blocks fail and the invalidation rules traders miss.
What nesting does not tell you
- It does not set direction above the anchor. A bullish daily nest inside a bearish weekly leg is still a counter-trend zone.
- It attracts stops. Several blocks at one price means many traders place stops just beyond the same lows. A liquidity sweep, a wick through a level that takes those stops before price reverses, can run through the inner blocks and still leave the anchor intact. Entering at the first touch of the smallest block is where this hurts most.
- It says nothing about timing. Price can sit inside an anchor for many candles before it reacts or gives up.
- It is easy to see in hindsight. After a rally, anyone can find three boxes at the low. The useful question is whether the nest was visible, on closed candles, before the move.
How to find nested order blocks with the MOB scanner on LiquidityScan
Checking nesting by hand means opening three timeframes per market and comparing highs and lows. The Mega Order Block scanner does that comparison for you. Its trigger is two or more order blocks nested inside a higher-timeframe anchor block. It reports only on closed candles, so a block is never counted from a candle that is still forming. LiquidityScan is software and education, not a signal service: a MOB detection is context for your own decision, never an instruction to buy or sell.
- Create an account. Pages inside the app need a free account, which you can open on the sign-up page.
- Start on All Scanners. All Scanners shows all 15 scanners on one page with live counts. The Mega Order Block card tells you how many nests are live right now and shows how the pattern works.
- Open the MOB page. Go to the MOB scanner to see its live signals, its timeframe footprint and its filters.
- Choose the market mode. Every scanner runs in all three modes: Crypto, Forex and TradFi. The mode is a prefix in the address, so the forex version lives at
https://liquidityscan.io/forex/monitor/mob. - Read the grade. A detection carries one of two grades, MOB or MOB+. MOB+ is the top grade.
- Star what you want to follow. Starring a market on a scanner page adds it to your Watchlist, where all of its signals sit in one place.
- Set an alert. In My Alerts you choose which setups notify you by scanner, by market and by timeframe. Delivery is browser push, Android push and an in-app bell, and alerts are bundled so they do not flood you.
- Check the rest of the picture. X-Ray looks up one market across every scanner, a fast way to see whether anything else agrees with the nest. Free and Starter have a daily X-Ray limit; Base does not.
What you can do with MOB depends on the plan:
| Plan | MOB scanner |
|---|---|
| Free | A live count of MOB setups, not the setups themselves |
| Starter | The MOB scanner open to browse, without alerts on it |
| Base | Alerts on the premium scanners, MOB included |
| Pro | The top grade, MOB+, plus Confluence sequences |
For the full comparison, see what each LiquidityScan plan includes.
Three limits are worth knowing. The MOB scanner has no 5m or 15m timeframe. On LiquidityScan only two scanners have those: Fair Value Gaps (three-candle gaps left by a fast move) and CISD+ (nested Change in State of Delivery signals). A nest also does not last forever: when one stops holding, the scanner treats it as dissolved, and that is the message you get if you open an old link. And the scanner tells you the nest exists. Whether the anchor sits in a sensible place in the larger trend is still your call.
Using a MOB as the first step of a sequence
Confluence on LiquidityScan includes sequences, steps that must happen in a set order. One family is zone-first: a strong order block or a MOB stack forms, and then a CRT sweep in the same direction fires on the same timeframe. CRT, Candle Range Theory, is a sweep of a range high or low followed by a close back inside. These recipes exist for the 1H, 4H and daily charts in Confluence, and sequences belong to the Pro plan. The order matches the caveat above: the zone stands first, the stop run through it comes second.
MOB next to the other order block scanners
Three scanners on the platform deal with order blocks, and they answer different questions. Order Blocks (OB+) looks for a strong order block confirmed by a liquidity sweep; see how OB+ and OB++ order blocks are found. 3-OB is a continuation pattern built from three candles on a single timeframe, explained in what three stacked order blocks mean. MOB is the one about nesting across timeframes. The same nesting idea applied to CISD is covered in a lower-timeframe CISD inside a higher-timeframe one. For how to weigh MOB against MOB+ and the other grade labels, read what the scanner grades mean and how to use them.
Frequently Asked Questions
What is an order block inside an order block?
It is a lower-timeframe order block whose full range sits within a higher-timeframe order block of the same direction. The larger block is the anchor zone. The smaller one marks where inside that zone price turned and gives a tighter invalidation level.
Is a nested order block more reliable than a single order block?
It carries more context, because two or more timeframes mark the same price area, and it gives a narrower level to be wrong at. It is not a promise that the zone holds. Nested zones get swept and broken like any other, and this article gives no success figure because none is published.
Which timeframes should the anchor and the inner blocks be on?
The anchor goes on the higher timeframe and the inner blocks on clearly lower ones, for example daily, then 4H, then 1H. Avoid pairing timeframes that are almost the same. On LiquidityScan the MOB scanner does not use 5m or 15m.
What is the difference between MOB and MOB+ on LiquidityScan?
They are two grades of the same pattern: two or more order blocks nested inside a higher-timeframe anchor block. MOB+ is the top grade and belongs to the Pro plan. The Mega Order Block card on the All Scanners page shows how the pattern works.
Is the MOB scanner free?
On the Free plan you see a live count of MOB setups but not the setups. Starter opens the scanner to browse, Base adds alerts on it, and Pro adds the top grade MOB+.
Does the MOB scanner tell me when to buy or sell?
No. It reports that a nest exists on closed candles and grades it. LiquidityScan is not a signal service, so the entry, the stop and the decision to trade at all stay with you.
Related reading
- How to Refine an Order Block: From HTF Zone to Sniper Entry — the manual version of nesting, one timeframe at a time.
- Multi-Timeframe CISD: A Lower-Timeframe CISD Inside a Higher-Timeframe One (CISD+) — the same nesting logic applied to a shift in delivery.
- How to Find Strong Order Blocks That Took Liquidity (OB+ and OB++) — the single-zone scanner that sits beside MOB.