
The ICT forex strategy in short
An ICT forex strategy treats the day as three linked sessions instead of one continuous chart. You set a daily bias, mark the high and low of the Asian session, wait for London to push price through one side of that range, and consider a trade only after price snaps back and shifts structure in the direction of your bias. New York then either extends London's move or reverses it. The target is always liquidity, meaning the stop orders resting above old highs and below old lows on the other side.
Everything below is detail on that one idea: what to mark before each session, which candle confirms the read, where it is invalid, and which days offer nothing. The method comes from ICT (Michael J. Huddleston), and the session windows follow his convention of quoting New York time.
Before the first session: bias and levels
Session trading without a bias is guessing which side of the range gets raided. Two things belong on the chart before Asia ends.
Daily bias. Bias is the direction you expect today's daily candle to expand. The practical way to set it is to find the draw on liquidity, the nearest obvious level price has a reason to reach: yesterday's high or low, a cluster of equal highs, or an unfilled daily fair value gap (FVG, a three-candle gap where the wicks of the first and third candle do not overlap). A simpler mechanical read: if the last daily candle closed above the high of the candle before it, lean bullish for the next one; if it closed below the prior low, lean bearish. If it closed inside the prior range, you have no clean bias, and that is useful to know before London opens. A separate article explains how a daily bias is read on every market before the session.
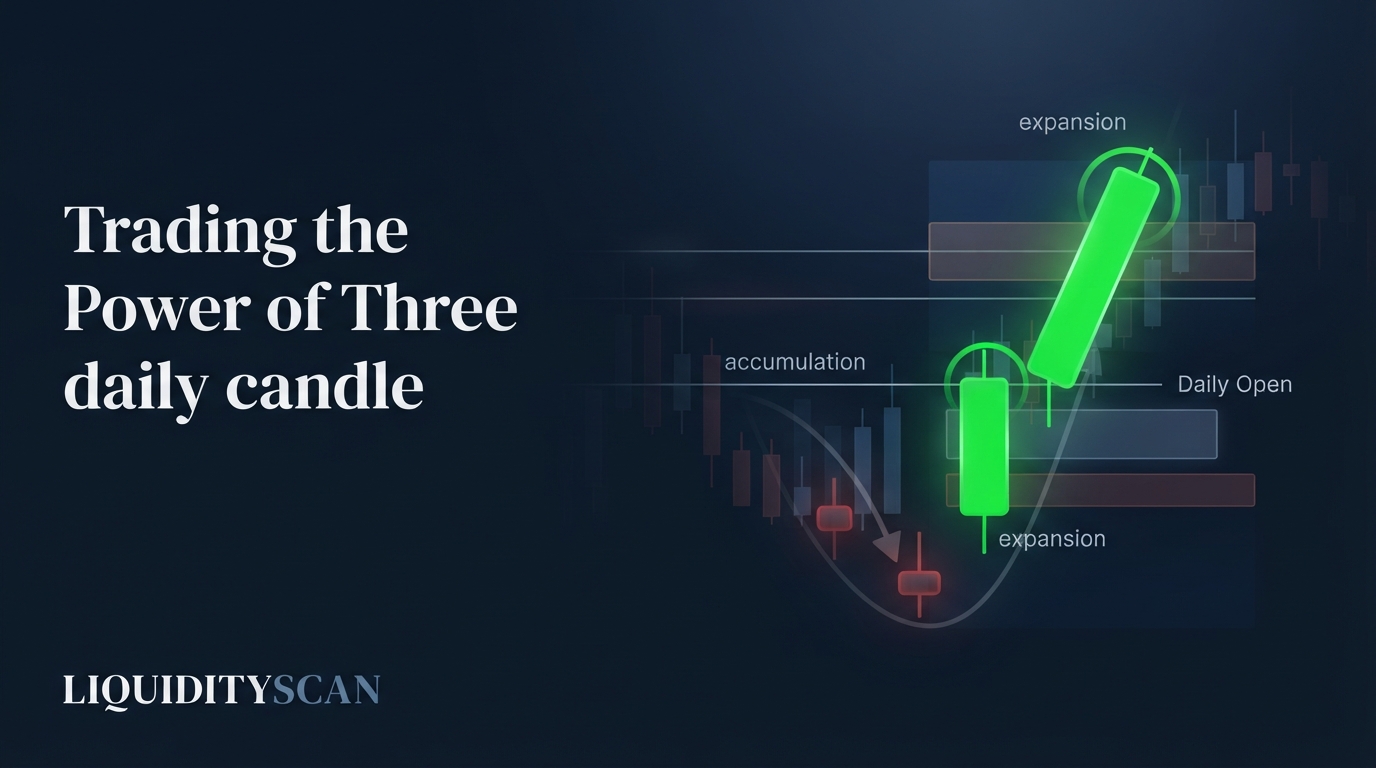
Levels. Mark the previous day's high and low, the Asian high and low once they exist, and the midnight New York open. ICT's power of three (accumulation, manipulation, distribution) expects a bullish day to dip below its open first and expand upward afterwards. Longs taken under the midnight open fit that model. Longs taken far above it are late.
The forex day at a glance
| Session | Window (New York time) | Role in the day | What you look for |
|---|---|---|---|
| Asia | 20:00–00:00 | Builds the range | A narrow range with a clear high and low. Usually no trade. |
| London | 02:00–05:00 | Raids one side of Asia and starts the move | A sweep against the bias, then a structure shift with it |
| New York | 07:00–10:00 | Continues or reverses London | A pullback into London's zone, or a sweep of London's extreme at a higher-timeframe level |
| London close | 10:00–12:00 | Pullback into the day's range | Trade management, not new trend entries |
| New York afternoon | 13:00–16:00 | Thin for currencies | Usually nothing |
These windows are called kill zones: the hours when a session's volume arrives and the setups in this playbook are expected to form. The same patterns print outside them with less follow-through. The kill zone times for forex and the pairs that suit each window have their own guide. If you do not live on New York time, convert the session times to your timezone once and write them down, because the windows follow New York clocks and move with daylight saving.
The entry sequence used in every session
The sessions change and the sequence does not. Each step has to complete before the next one counts.
- Sweep. Price trades beyond a marked level (the Asian high or low, or the previous day's high or low) and does not stay there. You want the candle to close back inside the range. A wick through the level is a sweep. A close through it, followed by a second candle holding beyond, is starting to look like a breakout.
- Shift. Price leaves with displacement, a run of large-bodied candles with little overlap. The earliest confirmation is a CISD (change in state of delivery): a candle closes back beyond the level where the run of candles into the sweep began. The stricter one is an MSS (market structure shift): a close beyond the last short-term swing made before the sweep.
- Zone. The displacement leaves an FVG, an order block (the last opposing candle before the displacement), or both. The entry idea is a retrace into that zone. Chasing the displacement candle puts the stop too far away.
- Invalidation. The extreme of the sweep. If a candle closes back beyond that wick, the read was wrong and the "sweep" was the start of a real move.
- Target. The nearest opposing liquidity: the other side of the Asian range first, then the previous day's high or low, then the daily draw.
Asian session: let the range form
For EUR, GBP and CHF pairs, Asia is usually the quietest part of the day, and that is its value. It leaves a narrow range with stops collecting above its high and below its low. Your job is to mark it, and the guide to marking the ICT Asian range covers which hours to use.
A usable range is narrow compared with recent days and has both edges tested at least once, so there are visible highs and lows for London to raid. JPY, AUD and NZD pairs are the exception. Their home markets are open, Asia can trend on them, and a range that has already travelled a long way leaves London with less to do.
London: the sweep and the first real move
London is where the model does most of its work. In ICT's teaching this session frequently sets the high or low of the day, and its opening move is often a fake: the Judas swing, a push against the day's real direction that raids the Asian range before price turns.
Take a hypothetical major pair with a bullish daily bias and an Asian range between 1.0820 and 1.0850. Shortly after 02:00 New York time price drops to 1.0812, under the Asian low, and the sell stops there are filled. A 15-minute candle then closes back above 1.0820, and the next candles rally hard enough to close above 1.0835, the last 15-minute swing high made before the drop. That close is the shift. The rally left a gap between 1.0826 and 1.0831. The long idea is a retrace into that gap, invalid on a close below 1.0812, with the Asian high at 1.0850 as the first objective and the previous day's high beyond it.
The bearish version mirrors it: bearish bias, London runs the Asian high, structure shifts down. The sweep to leave alone is the one that agrees with nothing. If the bias is bullish and London raids the Asian high first, that is either the real move starting without you or a trap for early longs, and neither is this setup. For the structure step on its own, see how to spot a market structure shift on major pairs.
New York: continuation or reversal
By 07:00 New York time London has shown its hand, and New York has two scripts.
Continuation. London swept Asia against the bias and moved away, but the daily draw has not been reached. New York often opens with a pullback into the FVG or order block London left behind, or with a small raid on a low formed late in the London morning, and then carries on toward the draw. The entry sequence is identical, one session later, and the invalidation sits beyond the New York pullback instead of London's extreme.
Reversal. London has already delivered price into the higher-timeframe level: the previous day's high, a daily FVG, a weekly level. With the draw met, the move has no reason left to extend. New York sweeps London's extreme, shifts structure the other way and trades back into the day's range. This script needs that higher-timeframe level. A London high on its own is not a reason to fade.
Scheduled US data commonly lands at 08:30 New York time, inside the window. The release is frequently the sweep itself, a spike through a level and a fast return. Waiting for the candle to close before reading it costs some price and spares you from trading the spike. The hours when both centres are open are covered in why the London–New York overlap produces the day's largest moves.
London close and the afternoon
From 10:00 to 12:00 New York time London desks finish their day, and on a trending day price tends to pull back into the range it built. For this playbook the window is about management: a position held from London or New York that has reached its draw has little reason to stay open through it. Some traders fade the day's extreme here. That is a counter-trend trade against the move you were just trading with, so expect less from it. After 12:00 currency volume thins, and the 13:00–16:00 window matters more to index traders.
Where this playbook fails
- No bias. When the daily candle closed inside the prior range, London can raid both the Asian high and the Asian low before choosing a side. The sequence still prints, twice, in opposite directions.
- No range. If Asia trended or was unusually wide, the stops have already been taken and there is nothing tight for London to sweep.
- A sweep that is a breakout. Price closes beyond the level and holds. Without displacement back through structure, step two never happens and there is no trade.
- News days. Around central bank decisions and major data, spreads widen and levels are run through in both directions within minutes.
- The wrong instrument. Exotic pairs have wide spreads and gappy prices, so a wick through a level may be spread and not a stop raid. The comparison of majors, crosses and exotics for ICT traders explains which pairs give readable sweeps.
- Clock errors. The UK and the US change clocks on different dates, so for a short stretch in spring and autumn London's open lands an hour off in New York time.
- Hindsight. Yesterday's chart always shows a clean sweep and shift. In real time you see a wick and must wait for a close, and some days the move leaves without a retrace. A missed trade of that kind is part of the model.
The playbook also says nothing about how far a move will run. The draw is a target, and price is free to stop short of it.
How to follow the sessions in LiquidityScan's Forex mode
LiquidityScan is a scanner, not a signal service: it reports ICT patterns on closed candles and leaves the decision to you. The Forex mode scanner page shows all 15 scanners running on 72 forex instruments: 7 majors, 21 crosses, 39 exotics and 5 metals. Pages inside the app need a free account, which you can create here.
The steps of the playbook map onto the scanners like this:
- Bias. The Bias scanner applies the mechanical rule from earlier: a close above the previous candle's high sets a bullish bias for the next candle, a close below its low sets a bearish one. It is one of the 8 classic scanners, free to read.
- The London sweep. The Asia Range Sweep scanner looks for an Asian-range liquidity sweep plus a reversal, aligned to a daily bias. Liquidity Sweep and Market Structure cover the raid and the shift separately. Market Structure reports BOS (break of structure, a break that continues the trend) and CHoCH (change of character, the first break against it). All three are premium scanners: Free shows a live count, Starter opens the setups to browse, and alerts on them belong to the Base plan and above.
- The shift. The CISD scanner is a classic one. It fires when a candle closes back beyond the level where the last run into the swing low or high began.
- The zone. Order Blocks (OB+, a strong order block confirmed by a liquidity sweep) and Fair Value Gaps are premium scanners with graded zones.
On timeframes: most scanners work on 1H, 4H and 1D. Only Fair Value Gaps and CISD+ also have 5m and 15m, and those two intraday timeframes belong to the Base plan and above. So the scanners give you the bias and the hourly picture of each session, and an entry refined on a lower timeframe than a scanner covers is done on your own chart. Bias, CRT and CISD signals on 1H and 4H carry a KZ tag when the signal candle opened inside the 12:00–16:00 UTC kill zone, which falls in the New York morning. Exotic pairs sit on a separate tab and stay out of alerts unless you pick them.
Frequently Asked Questions
What is the best session to trade forex with ICT?
London and New York carry the setups in this playbook, because that is when the Asian range gets raided and the day's direction shows. Which of the two suits you depends on your timezone and your pairs. One session traded consistently teaches more than three traded tired.
What are the ICT kill zone times for forex?
In New York time: Asia 20:00–00:00, London 02:00–05:00, New York 07:00–10:00 and London close 10:00–12:00. They follow New York clocks, so they shift with daylight saving in your local time.
Which timeframes does an ICT forex strategy use?
Daily and 4H for bias and the draw on liquidity, 1H to mark the Asian range and see the sweep, and 15-minute or 5-minute for the structure shift and the entry zone. A lower timeframe gives a tighter stop and more false shifts.
Do I have to wait for the Asian range to be swept?
The sweep can also be of the previous day's high or low, or of a London extreme during New York. What the model cannot do without is a sweep of some marked level followed by a shift. If neither appears, there is no setup that day.
Does the session playbook apply to gold and exotic pairs?
The session logic applies to anything that trades through Asia, London and New York, gold included, though gold travels further and faster, so ranges and stops have to scale with it. Exotics are harder to read because wide spreads and gaps distort the wicks the model depends on.
Can LiquidityScan trade this strategy for me?
No. It is not a broker or a signal service and never tells anyone to buy or sell. It detects patterns such as bias, Asian-range sweeps and CISD on closed candles, and what you do with a detection is your own decision.
Related reading
- How to Trade EUR/USD With ICT Concepts — the playbook applied to the pair most traders start with.