
What a market structure shift is, and what changes in forex
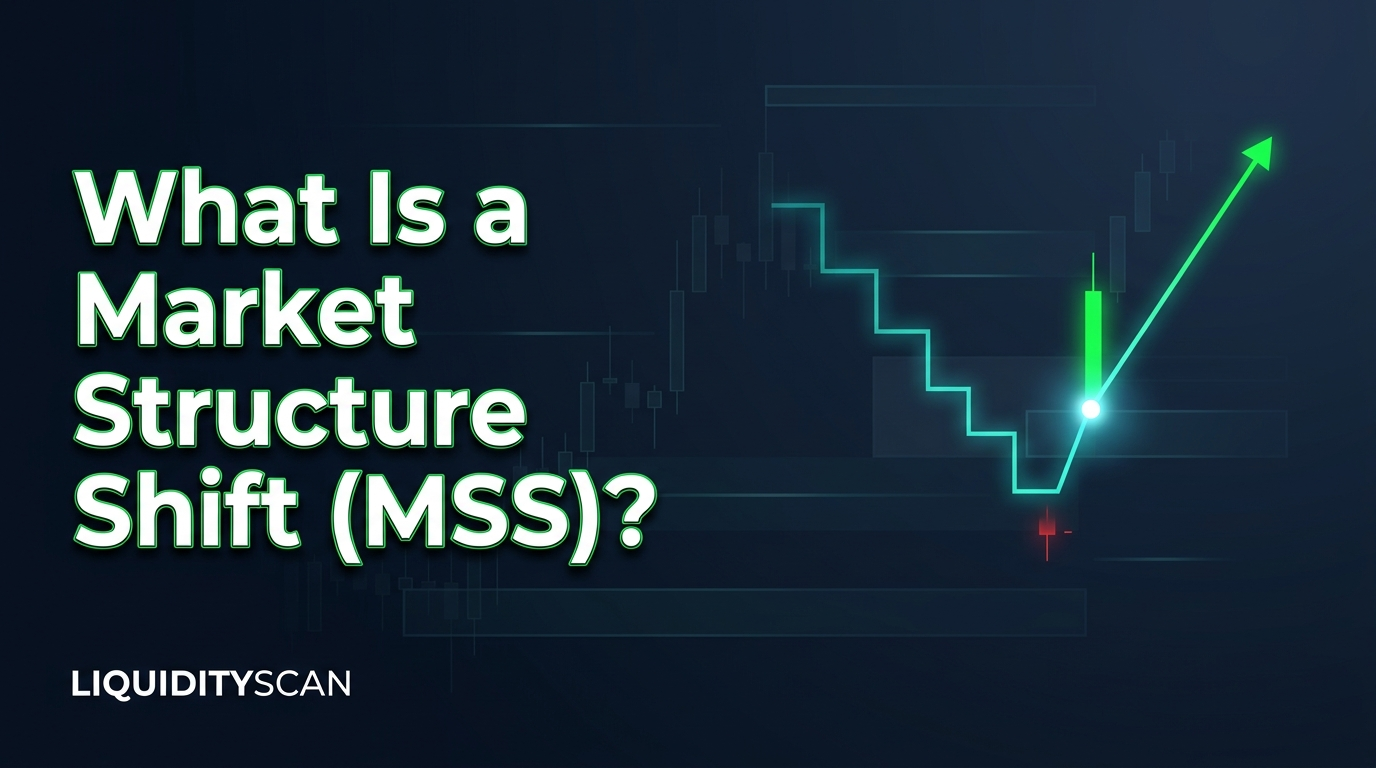
A market structure shift (MSS) is a short-term trend breaking in the opposite direction with force. Price takes liquidity beyond a swing high or low, reverses, and a candle closes through the nearest opposing swing point with displacement (a run of large-bodied candles with little overlap between them). In a down-move that means a sweep of a low followed by a close above the most recent lower high. In an up-move it is a sweep of a high followed by a close below the most recent higher low.
That definition is the same on every market. What changes in forex is where and when the pattern is worth reading. Major pairs spend hours in narrow ranges and do much of their repricing in a few session windows, so the same break of a 15-minute swing can be a real shift at the London open and noise three hours earlier. This article is about telling those apart on EUR/USD, GBP/USD, USD/JPY and the other majors.
The term comes from ICT (Michael J. Huddleston). For the market-neutral version, see the general MSS rules with examples.
The three parts of an MSS on a major pair
1. Liquidity is taken first
A liquidity sweep is a wick or brief push beyond a level where stop orders rest, followed by a return back inside. On forex majors the levels that collect those stops are easy to list: the Asian session high and low, the previous day's high and low, the previous week's high and low, and any cluster of equal highs or equal lows. An MSS that follows a sweep of one of these has a reason behind it: orders were filled against the stops and price turned. A swing break with no sweep before it is only a swing break. If you are not yet marking the overnight range, start with how to mark the ICT Asian range and why London sweeps its high or low.
2. The right swing breaks
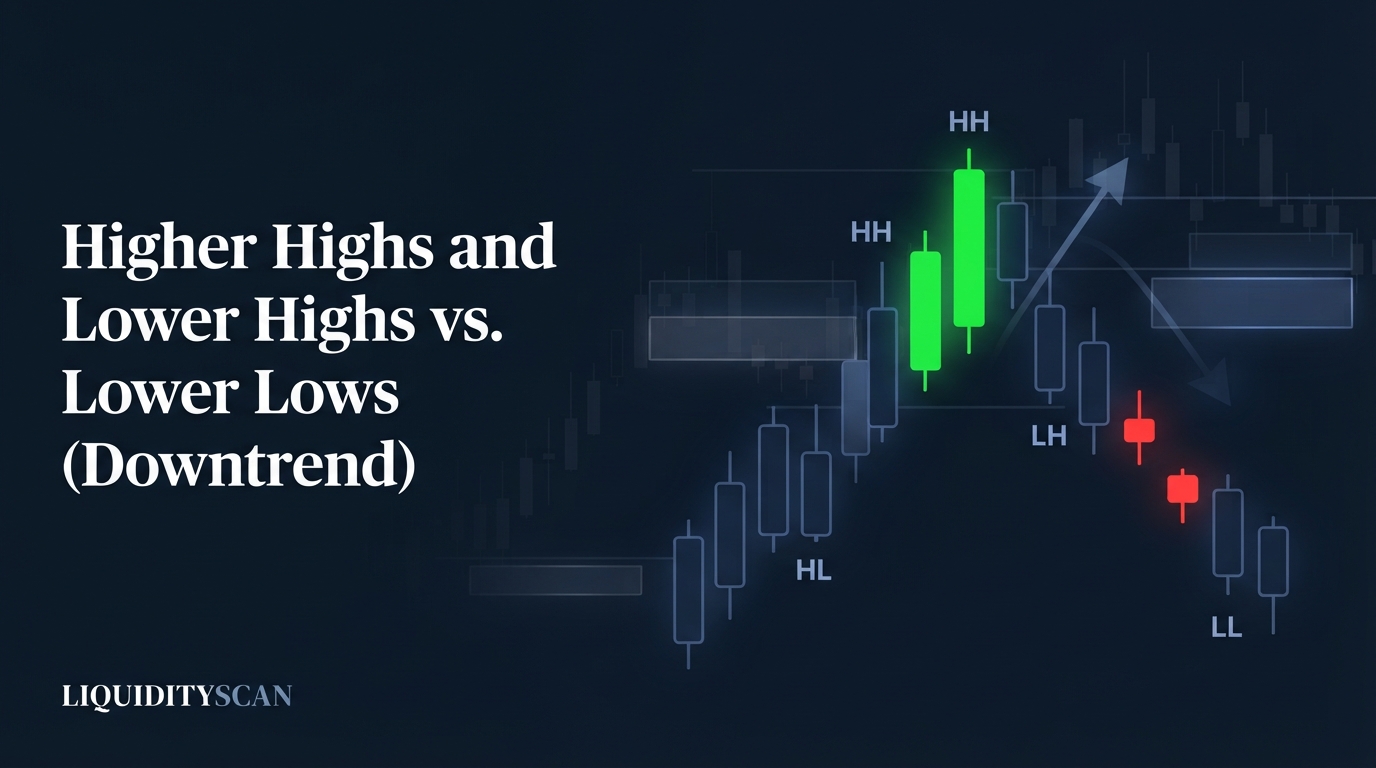
A swing high is a candle with a lower high on each side of it, and a swing low is the mirror (see the three-candle rule for swing highs and lows). For a bullish MSS the swing that matters is the last lower high printed before the sweep low, the final bounce sellers defended on the way down. Two mistakes are common. One is using a one-candle pause inside the last leg, which is too small and breaks constantly. The other is waiting for a swing high far above, by which time the shift is old and the entry is expensive. Decide what counts as a swing before the session, not while the candle is forming.
3. The break is a displaced body close
The candle has to close beyond the swing. A wick through it that closes back below is, if anything, a sweep of the stops resting above that lower high. The close should also arrive with displacement as ICT traders read it: two or three wide candles in one direction, usually leaving a fair value gap (FVG), a three-candle formation where, in an up-move, the first candle's high and the third candle's low do not overlap. A slow, overlapping crawl through the swing is a weaker message, because nothing was repriced in a hurry.
A bullish MSS on EUR/USD, candle by candle
The numbers below are invented to make the sequence easy to picture. They are not a record of a real session.
- EUR/USD trades the Asian session between 1.0850 and 1.0872. Sell stops collect under 1.0850.
- Early in the London session price sells off. On the 15-minute chart it bounces once, printing a lower high at 1.0858, then drops through the Asian low to 1.0841.
- The candle that reaches 1.0841 closes back at 1.0851, with its high at 1.0852. That is the sweep: the low was taken and price returned inside the range. Nothing has shifted yet. The 15-minute trend is still lower highs and lower lows.
- The next two candles are wide and bullish. The second one has its low at 1.0856 and closes at 1.0864, above the 1.0858 lower high. That close is the MSS.
- The up-leg leaves a fair value gap from 1.0852 to 1.0856, between the high of the sweep candle and the low of the second displacement candle.
What has to happen next for the idea to stay alive: price pulls back toward the gap or the midpoint of the leg from 1.0841 to 1.0864 (about 1.0852), holds above the sweep low, and then trades toward the Asian high at 1.0872, the nearest buy-side liquidity (stops resting above a high).
What invalidates it: a 15-minute close back below 1.0841. If the swept low gets closed through, the sweep was a breakout and the shift was a pause in a downtrend.
The bearish version is the mirror: a run above the Asian high, then a displaced close below the last higher low that formed on the way up.
MSS, CHoCH, BOS and CISD: which label is which
Traders use these loosely, so pin them down before reading anyone's chart, including a scanner's.
- BOS (break of structure): a close beyond a swing in the direction of the existing trend. It signals continuation.
- CHoCH (change of character): the first close beyond a swing against the existing trend.
- MSS: in most ICT usage, a counter-trend break that comes after a liquidity sweep and with displacement. Structurally it is a CHoCH. The sweep and the displacement are what earn it the name. The finer points are in CHoCH vs MSS and the real difference between them.
- CISD (change in state of delivery): a close back beyond the level where the last run of candles into the swept low or high began. That level sits closer to the extreme than the swing does, so a CISD tends to print earlier. That trade-off is the subject of CISD vs MSS and which confirms a reversal first.
Session timing: when a forex MSS deserves attention
Kill zones are the session windows in which ICT traders expect the day's main moves. In New York time the two that matter most for majors are London, 02:00 to 05:00, and New York, 07:00 to 10:00. The forex kill zone times and what to expect in each are covered separately. Here is how they change the reading of a structure break.
- London open. This is the textbook forex case. The Asian high or low is run, then structure shifts the other way on the 5- or 15-minute chart. The sweep target is obvious and the timing is tight, which makes this the easiest MSS to practise on.
- New York. The liquidity is now the London session's high or low, or the previous day's. An MSS here can reverse London's move or end a pullback within it. The higher-timeframe direction decides which reading is more plausible.
- Asian hours on European pairs. EUR/USD and GBP/USD tend to hold a narrow range, and small swings break in both directions inside it. Those breaks mark the range that will be swept later. They are not shifts.
- Asian hours on yen and Pacific pairs. For USD/JPY, AUD/USD and NZD/USD this is a home session, so a structure break there can carry more weight than the same break on a European pair.
- Rollover and news. Around the 17:00 New York rollover spreads widen and wicks get long. During high-impact releases, swings on both sides can break within minutes. Waiting for the candle to close filters part of this, but not all of it.
MSS checklist for major pairs
| Check | Supports the MSS | Weakens it |
|---|---|---|
| Liquidity | A session, daily or weekly high or low, or equal highs or lows, was swept just before | No sweep; the break came from the middle of a range |
| Swing | The last lower high (or higher low) before the sweep extreme | A one-candle pause, or a swing chosen after the fact |
| Break | Candle body closes beyond the swing | Wick through, close back inside |
| Displacement | Wide candles, little overlap, a fair value gap left behind | Slow, overlapping candles |
| Timing | Inside the London or New York kill zone | Mid-Asia on a European pair, rollover, the minutes around a news release |
| Higher timeframe | The sweep happened at a 4H or daily level, or the shift agrees with the 4H trend | A 5-minute shift running straight into an untouched higher-timeframe level |
| Invalidation | The sweep extreme still holds | A close back beyond the sweep extreme |
Where the MSS fails, and what it does not tell you
It is timeframe-relative. A 5-minute MSS against a clean 4H trend is frequently just the start of a pullback. Price shifts, retraces a little, then the higher-timeframe trend resumes and closes through the sweep extreme. The shift was real on its own timeframe and still wrong for anyone who treated it as the reversal of the day.
The retest is not owed to you. After the shift, price may never return to the fair value gap or the midpoint of the leg, or it may return and go straight through. The MSS tells you the short-term direction changed. It says nothing about how far the new move travels. The target is a separate decision, usually the next pool of liquidity.
One pair can shift alone. EUR/USD and GBP/USD both trade against the dollar and usually move in the same direction. If one sweeps its low and shifts up while the other breaks down cleanly, the dollar side is not confirming. Some traders treat that disagreement as information in itself: SMT divergence, where one of two correlated instruments makes a new extreme and the other does not. See reading EUR/USD against GBP/USD for SMT divergence.
Swing selection is subjective. Two traders can mark different lower highs on the same chart and see the MSS at different prices, or one sees it and the other does not. A fixed swing rule, written down, removes most of the hindsight.
How to find fresh structure breaks on forex pairs with LiquidityScan
Checking seven majors on three timeframes for a new swing break is twenty-one charts before every session. LiquidityScan's Market Structure scanner does that pass for you. It flags BOS and CHoCH events that shift the structure trend, and it reads closed candles only, so a break that exists only while a candle is still forming is not reported. Pages inside the app need a free account, which you can create on the sign-up page.
- Switch to Forex mode. It covers 72 instruments: the 7 majors (EUR/USD, GBP/USD, USD/JPY, USD/CHF, USD/CAD, AUD/USD, NZD/USD), 21 crosses, 39 exotics and 5 metals. Exotics sit on a separate tab because of their wide spreads and gappy prices. The forex version of the page is Market Structure in Forex mode.
- Check your plan. Market Structure is one of the seven premium scanners. On the Free plan you see how many setups are live, not the setups themselves. From Starter the scanner is open to browse.
- Read a CHoCH as the structural half of an MSS. The scanner tells you a swing was closed through against the previous trend. Whether liquidity was taken first and whether the break had displacement is context you add, on your own chart or with the Liquidity Sweep scanner (also premium) beside it.
- Mind the timeframe. Most LiquidityScan scanners work on 1H, 4H and 1D, and only Fair Value Gaps and CISD+ add 5m and 15m. Treat the structure scanner as a 1H-and-higher read, and look for the 5- or 15-minute shift inside a kill zone yourself.
- Set alerts if you want them. Alerts on Market Structure belong to the Base plan and above. You choose them by scanner, market and timeframe, and they arrive as browser push, Android push or the in-app bell. Exotic pairs are left out of alerts unless you pick them.
On the Pro plan, Confluence sequences match steps that must happen in a set order (a sweep, then a shift in structure, for example), and the Structure Map lists every BOS and CHoCH sequence pre-built with the markets that just completed it. In every case a detection is context for your own decision. LiquidityScan is not a signal service and does not tell anyone to buy or sell.
Frequently Asked Questions
Is a market structure shift the same as a CHoCH in forex?
Structurally, yes: both are a close beyond a swing against the existing trend. Most ICT traders reserve MSS for the case where that break follows a liquidity sweep and comes with displacement. A CHoCH with neither is a weaker event, even though the swing that broke is the same.
What timeframe should I use to spot an MSS on major pairs?
There is no single correct one. A common arrangement is direction from the 4H or daily chart, the sweep level from session or daily highs and lows, and the MSS itself on the 15- or 5-minute chart inside a kill zone. Swing traders read the same sequence on 1H or 4H after a sweep of a daily or weekly level. The lower the timeframe, the more shifts you will see and the more of them are noise.
Does a wick through the swing count as a market structure shift?
No. The candle has to close beyond the swing. A wick that pierces the level and closes back inside has only taken the stops resting there, which is closer to a sweep than a shift. Wait for the close before deciding what happened.
What invalidates a market structure shift?
A close back beyond the sweep extreme. For a bullish MSS that is a close below the low that was swept; for a bearish one, a close above the swept high. Once that happens the earlier break was a pause in the original trend, and the reversal idea is over on that timeframe.
Why do MSS setups on EUR/USD fail during the Asian session?
EUR/USD tends to hold a narrow range in Asian hours, so small swings break in both directions without a meaningful sweep before them or displacement behind them. Those breaks define the range that London later trades against. They lack two of the three parts an MSS needs.
Can a scanner detect a market structure shift automatically?
A scanner can detect the structural break. LiquidityScan's Market Structure scanner flags BOS and CHoCH on closed candles in its Forex, Crypto and TradFi modes. Whether a sweep came first and whether the break was displaced is something you confirm yourself or by checking the Liquidity Sweep scanner on the same market.
Related reading
- Liquidity Sweep Then Structure Shift: The Stop-Hunt-to-Reversal Sequence — the two-step order behind every MSS, explained on its own.
- How to Trade EUR/USD With ICT Concepts — the pair used in the example above, with its session habits and key levels.
- ICT Forex Strategy: A Session-by-Session Playbook — where the MSS fits in a full trading day from Asia to the New York close.
- ICT Entry Sequence: How to Follow Sweep, Structure Shift and Entry as the Setup Forms — what to do after the shift prints and before an entry exists.