
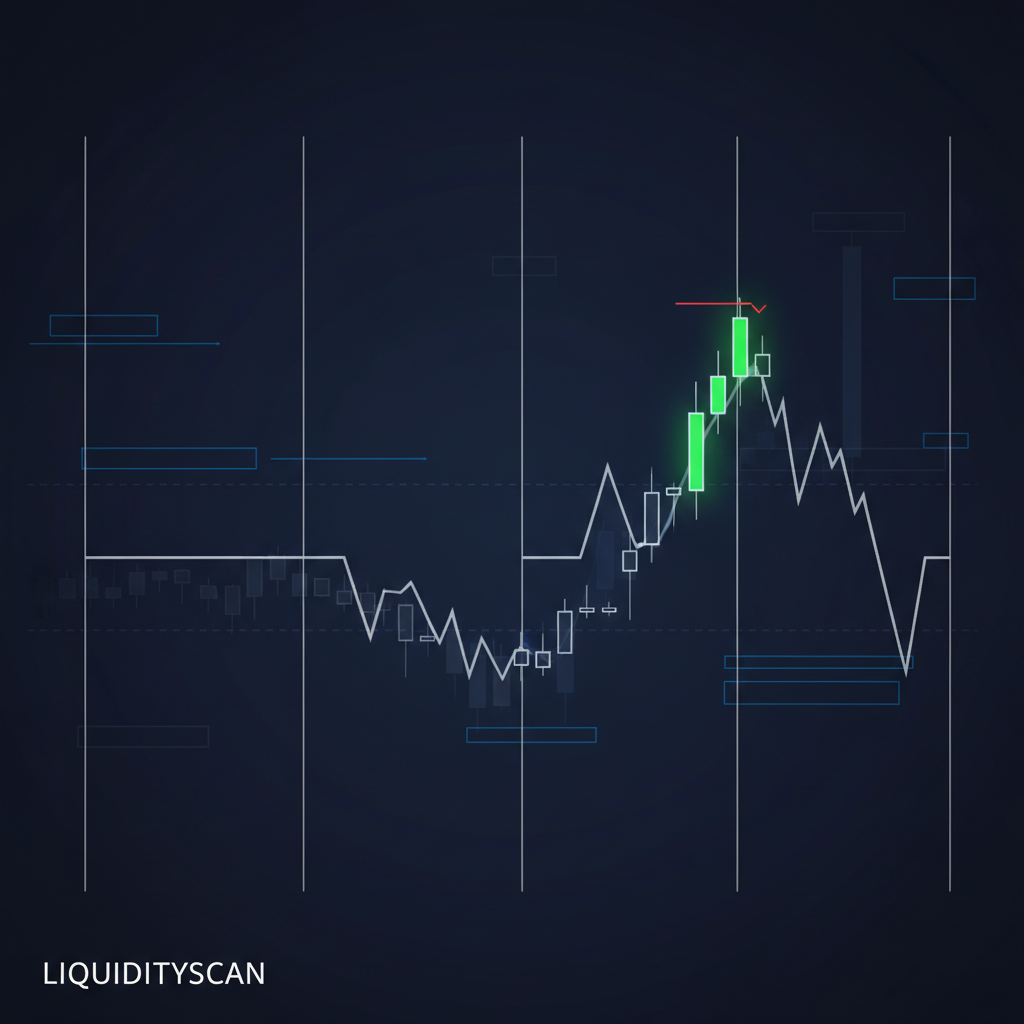
Most traders read price and ignore time. ICT quarterly theory flips that. It argues the market delivers price on a schedule you can divide into repeating quarters.
Once you see the structure, sessions stop looking random. Each quarter has a job, and those jobs repeat from the yearly cycle all the way down to a few minutes.
What Is Quarterly Theory?
Quarterly theory is a time model. It states that any market cycle can be divided into four equal quarters, labeled Q1 through Q4, and that price behaves predictably across them.
The core claim is fractal. The same four-part rhythm appears in the year, the month, the week, the day, and even inside a single 90-minute block.
Time here is anchored to New York time, not your local clock. That matters because the reference points below only line up when everyone measures from the same session boundaries.
Splitting Time Into Quarters
The model nests cycles inside cycles. A yearly quarter contains months; a monthly quarter contains weeks; a daily quarter contains 90-minute blocks; and each 90-minute block splits into micro-quarters of about 22.5 minutes.
The table below shows how the same four-quarter split repeats at each scale. Read it top to bottom as a zoom-in.
| Cycle | Full length | One quarter | Q2 window (True Open zone) |
|---|---|---|---|
| Yearly | 12 months | ~3 months | Apr–Jun |
| Monthly | ~4 weeks | ~1 week | 2nd week |
| Weekly | Mon–Fri | ~1 day | Tuesday |
| Daily | 24 hours | 6 hours | 06:00–12:00 NY |
| 90-minute | 90 min | ~22.5 min | 2nd micro-block |
Notice the pattern: the second quarter of every cycle is where I focus. That is where the reference open sits and where manipulation tends to complete before the real move.
The True Open
The True Open is the price at the start of the second quarter of a cycle. On the day, for example, it is the 06:00 New York open rather than midnight or the session bell.
Why the second quarter? Quarterly theory treats Q1 as an accumulation phase that often sets a false tone. The True Open filters that noise and gives a cleaner bias line.
In practice I mark the True Open and watch how price relates to it. Trading above it leans bullish for the cycle; trading below it leans bearish. It becomes a running scorecard for intent.
Because the market opens and closes on published schedules, aligning your clock to the exchange session is essential. The CME Group trading hours reference is a reliable anchor for U.S. session boundaries.
AMD Within Each Cycle
AMD stands for accumulation, manipulation, and distribution. Quarterly theory maps this three-phase story onto the four quarters, which is closely related to the Power of 3 concept.
Q1 is accumulation: price coils and builds positions in a range. Q2 is manipulation: a stop-raid pushes against the eventual direction, often sweeping liquidity around the True Open.
Q3 is distribution: the genuine expansion move where the cycle reveals its hand. Q4 is continuation or reversal, often drifting into the next cycle's accumulation.
This is why the second quarter earns so much attention. The manipulation leg is the trap that seeds the real trend, and the True Open sits right inside it.
How to Trade Quarterly Theory
The workflow is top-down alignment. Establish the higher cycle's quarter and bias first, then hunt a lower-cycle setup that agrees with it.
For example, if the weekly cycle is in its Q3 distribution phase and pointing up, I look for a daily or 90-minute cycle that offers a long entry after its own Q2 manipulation completes.
The 90-minute and micro windows are where entries actually trigger. I don't re-explain those windows here; instead I lean on macro timing and kill-zone material, linked below, to time the trigger inside the aligned quarter.
A tool like LiquidityScan helps me stay honest about which cycle I'm in, so I don't force a lower-timeframe entry against the higher quarter's story.
Limitations
Quarterly theory is a framework, not a guarantee. Cycles do not always run clean, and a manipulation leg can extend far past a tidy quarter boundary.
The model also relies on precise, consistent time anchoring. If your clock or session definition drifts, your True Open and quarter labels drift with it, and the edge evaporates.
Treat it as a bias filter that stacks with structure and liquidity, not as a standalone signal. Backtest it on your own market before you trust it live.
Frequently Asked Questions
What is the True Open in quarterly theory?
The True Open is the price at the start of a cycle's second quarter, such as 06:00 New York on the daily cycle. It acts as a cleaner bias reference than the standard session open because it filters early Q1 noise.
How does quarterly theory relate to AMD and Power of 3?
Quarterly theory maps accumulation, manipulation, and distribution onto the four quarters, with manipulation clustering around the True Open in Q2. This is the same accumulation-manipulation-distribution logic behind the Power of 3 concept, expressed on a time grid.
Is quarterly theory the same as kill zones or macro times?
No. Kill zones and macro times define specific intraday windows for activity. Quarterly theory is the broader fractal time-cycle model; it uses those windows to time entries but describes the whole nested cycle structure.
Related query paths
Use these to time your entry inside the aligned quarter and to understand session structure.
- ICT macro times: the 20-minute windows — the micro-cycle windows where entries trigger.
- ICT kill zones: complete guide — session timing that frames each daily quarter.
- ICT Silver Bullet: 10am vs 3am — a time-specific setup you can run inside a quarter.
- Evolution of ICT Concepts: A Timeline of Key Models
- fractal market structure across nested timeframes — See how fractal structure maps price delivery across multiple timeframes.
- ICT concepts explained: the complete list — Review related ICT time, liquidity, and market-structure terms in one list.