
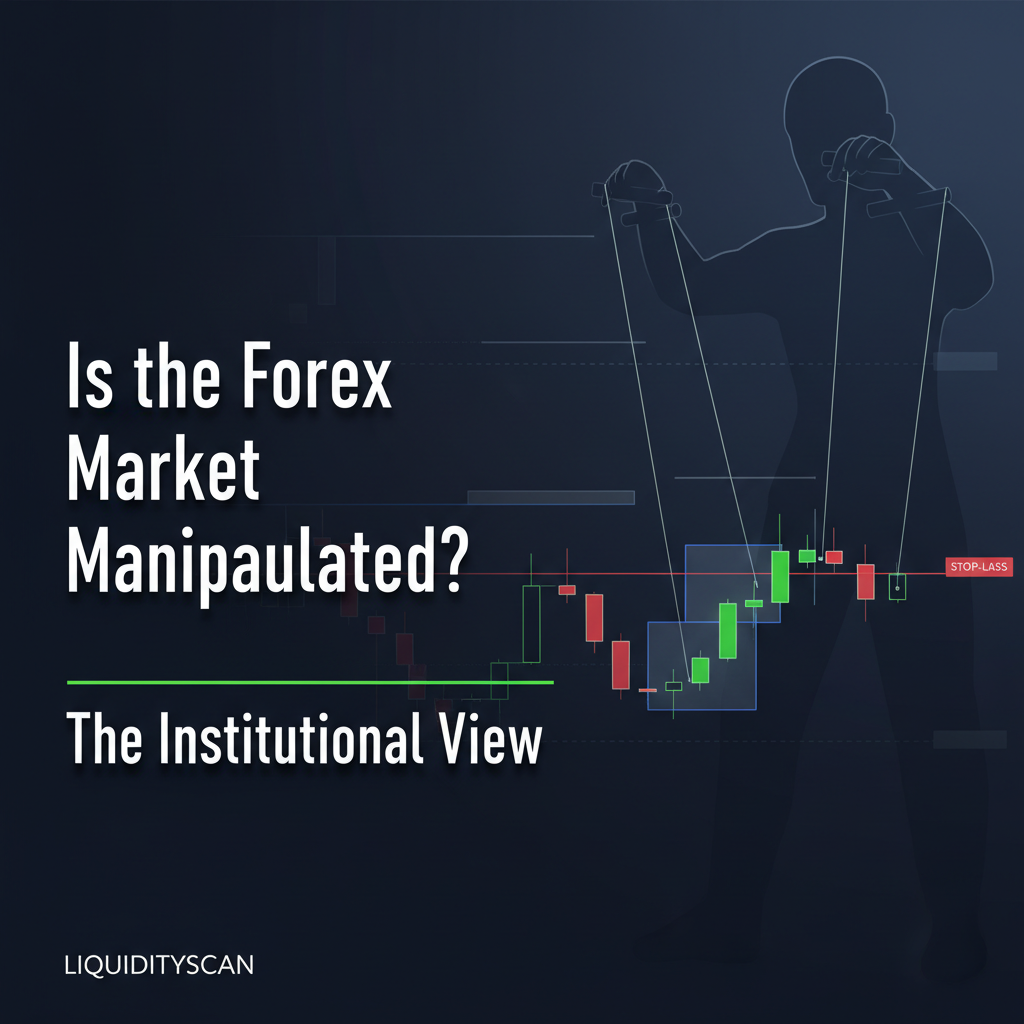
From 'Manipulation' to 'Engineering': A Necessary Shift in Perspective
Every trader has lived this moment. You take a trade, tuck a stop-loss just below a recent low because that's where the textbook says it belongs, and then watch price drive straight through it, sweep your stop, and rip back in your original direction. It feels personal. It feels rigged. But what if none of it is aimed at you? What if it’s just a machine doing exactly what it was built to do?
The modern forex market moves trillions of dollars a day, and almost none of that flow comes from humans shouting in a pit anymore. It's dominated by algorithms. A 2022 Reuters report noted that algorithms now drive the majority of orders at large banks, and the Bank for International Settlements has published extensive research on high-frequency trading in FX that points the same way. The engine we care about as ICT traders is what the methodology calls the Interbank Price Delivery Algorithm (IPDA).
This isn't a single block of code you can crack open and reverse-engineer. It's a dynamic system that governs how price travels from one level to the next, and it carries a dual mandate:
- Seek Liquidity: It actively hunts for pools of buy-side and sell-side liquidity. That means it targets areas where orders cluster, like the buy stops sitting above old highs and the sell stops resting below old lows. If you want the mechanics of how those pools get taken, our breakdown of what a liquidity sweep actually is covers it.
- Rebalance Price: It works to close inefficiencies, like Fair Value Gaps (FVGs). When price moves hard in one direction, it leaves a void behind. The algorithm will often circle back to that area to rebalance delivery.
So that stop hunt that felt so personal? It wasn't an attack. Your stop was simply part of a pool of sell-side liquidity the algorithm needed to collect before it could push higher. It’s a feature, not a bug. Trading the difference between a malicious manipulator and a logical, unemotional algorithm starts in your head, and that shift is the first real step toward working with the market instead of fighting it.
How to Spot the Algorithm's Footprints on the Chart
If price is engineered, the engineering has to leave a trail. To a trained eye, those footprints are scattered all over the chart. They’re the foundation of Smart Money Concepts and they give you a framework for anticipating where price wants to go next.
Take the Judas Swing that so often shows up during the London Open kill zone. I've watched this setup chew up traders on EUR/USD and GBP/USD more times than I can count before they finally learn to sit on their hands. Price runs above the Asian session high first, lifting the buy-side liquidity parked there. Retail sees a breakout and piles in long. But the whole move is inducement. The moment that liquidity is captured, price reverses hard, leaving the breakout crowd trapped and feeding the session's real leg. That reversal usually arrives with strong displacement, printing a Market Structure Shift (MSS) on a lower timeframe like the 5- or 15-minute. (If you want to see how this trap differs from its cousin, the Judas Swing versus Turtle Soup comparison lays both out side by side.)
These are the signatures worth memorizing:
- Liquidity Sweeps: Hunt for clean, equal highs or lows where liquidity stacks up. The algorithm is drawn to those levels like a magnet. A sharp wick or a quick poke through the level followed by an immediate rejection is the tell-tale sign of a grab.
- Displacement & FVGs: After a sweep, look for a strong, energetic move away from the level. That’s displacement. When the velocity is high enough to leave a three-candle Fair Value Gap behind, you’re looking at a powerful signal that institutions have stepped in and are repricing with intent. That FVG becomes a high-probability point of interest for a later entry, and confirming it with order flow separates the gaps that hold from the ones that don't.
- Market Structure Shifts (MSS / CHoCH): A sweep paired with displacement frequently flips the structure. Sweep sell-side liquidity below a low, then push up hard enough to break a recent short-term high, and you’ve got a Change of Character (CHoCH) or MSS. The algorithm is telling you its intent has rotated from seeking sell-side to seeking buy-side. The line between these two terms trips up a lot of people, so our guide on BOS versus CHoCH is worth a read if the distinction feels fuzzy.
Trading With the Algorithm, Not Against It
Once you accept that the market is an engineered environment, the whole way you trade changes. You stop being the prey and start thinking like the operator. Instead of dropping your stop-loss into the most obvious pool of liquidity, you start asking a better question: where is the liquidity the algorithm is likely to reach for next?
This is where framing trades inside a premium and discount array becomes critical. The algorithm is built for efficiency, so it wants to buy at a discount and sell at a premium. After a break of structure (BOS) to the upside, you wait for price to retrace back into the discount zone, below the 50% equilibrium of the range, before you go hunting for a long. Your entry should be a refined point of interest inside that zone, like a bullish order block or a Fair Value Gap.
This takes patience, and patience is the part most people skip. It means not chasing the first breakout. It means letting the algorithm show its hand, confirming its intent with a structural shift, and only then taking the entry it hands you at a logical level. That discipline is the heart of an Optimal Trade Entry (OTE).
Tracking all of this by hand, across dozens of pairs and timeframes in real time, is brutal work. That's exactly why we built LiquidityScan. The platform automates the detection of these algorithmic footprints. The CRT (Candle Range Theory) engine, for one, is designed to flag when the high or low of a previous candle range has been violated, which is a core piece of spotting liquidity sweeps on closed candles. Instead of burning hours staring at charts, you get alerts when high-probability conditions are lining up, so your energy goes into execution rather than endless scanning. If you're new here, this is what LiquidityScan does in a nutshell.
Frequently Asked Questions
- But haven't banks been fined for manipulating forex rates?
- Yes, and those were serious scandals. Banks colluded to fix benchmark rates like the WM/Reuters fixing. That's criminal activity, and it's a completely different animal from the minute-to-minute algorithmic price delivery we're talking about here. Rate fixing is about rigging a specific benchmark used for settlement. Algorithmic price delivery is the underlying mechanic of how the market moves to facilitate volume and balance order flow. One is illegal collusion; the other is the physics of the modern market.
- If it's an algorithm, can't we just reverse-engineer it for perfect predictions?
- No. It isn't a single, static piece of code. Think of it as an adaptive system reacting to trillions of dollars in order flow, economic data, and its own internal state, all at once. We don't chase perfect prediction. The goal as a trader is to spot the high-probability scenarios where the algorithm's objectives, read through the narrative of liquidity and inefficiency, become temporarily clear. We trade probabilities, not certainties.